🧠 How Neural Networks Learn
Welcome to the fascinating world of Gradient Descent!
The algorithm that teaches machines to recognize patterns
📚 Quick Recap: What Are We Trying to Do?
Our Goal: Digit Recognition
We want our neural network to look at handwritten digits and correctly identify what number they represent.
.png)
How It Works
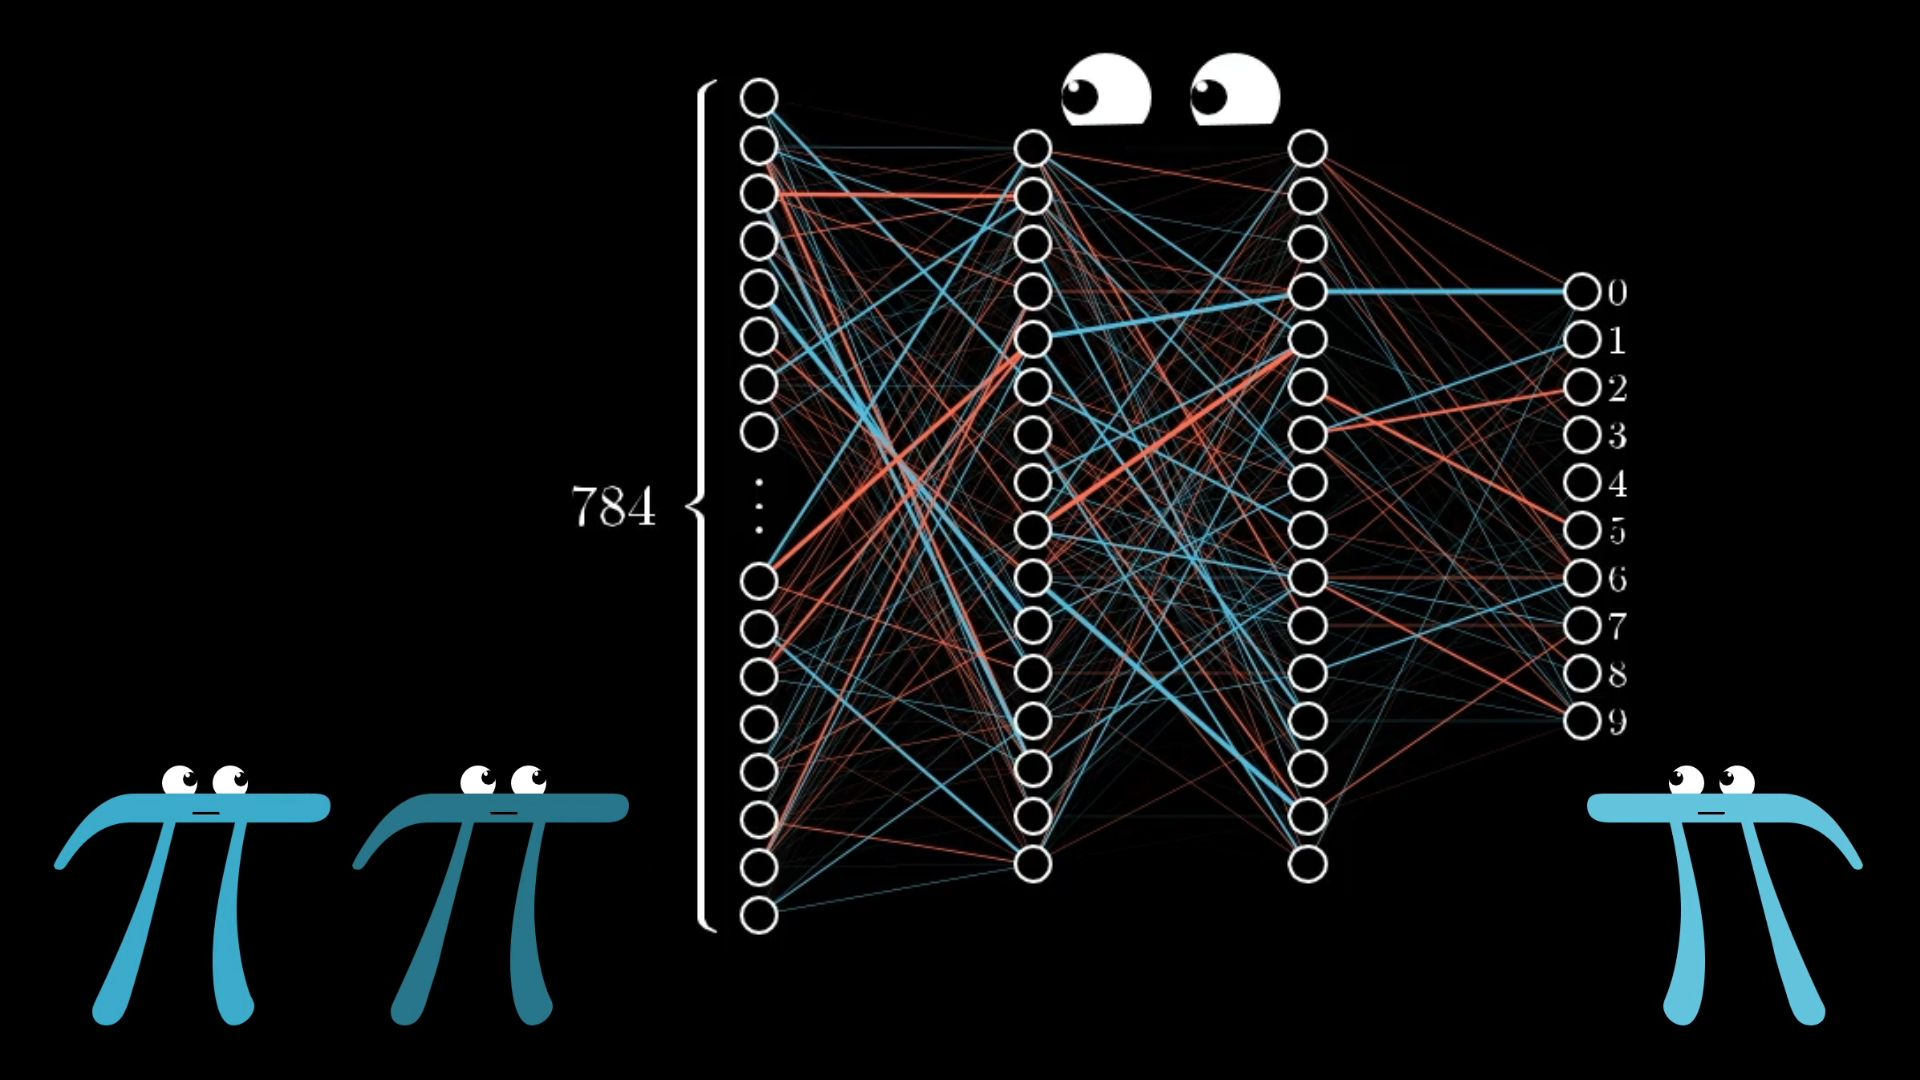
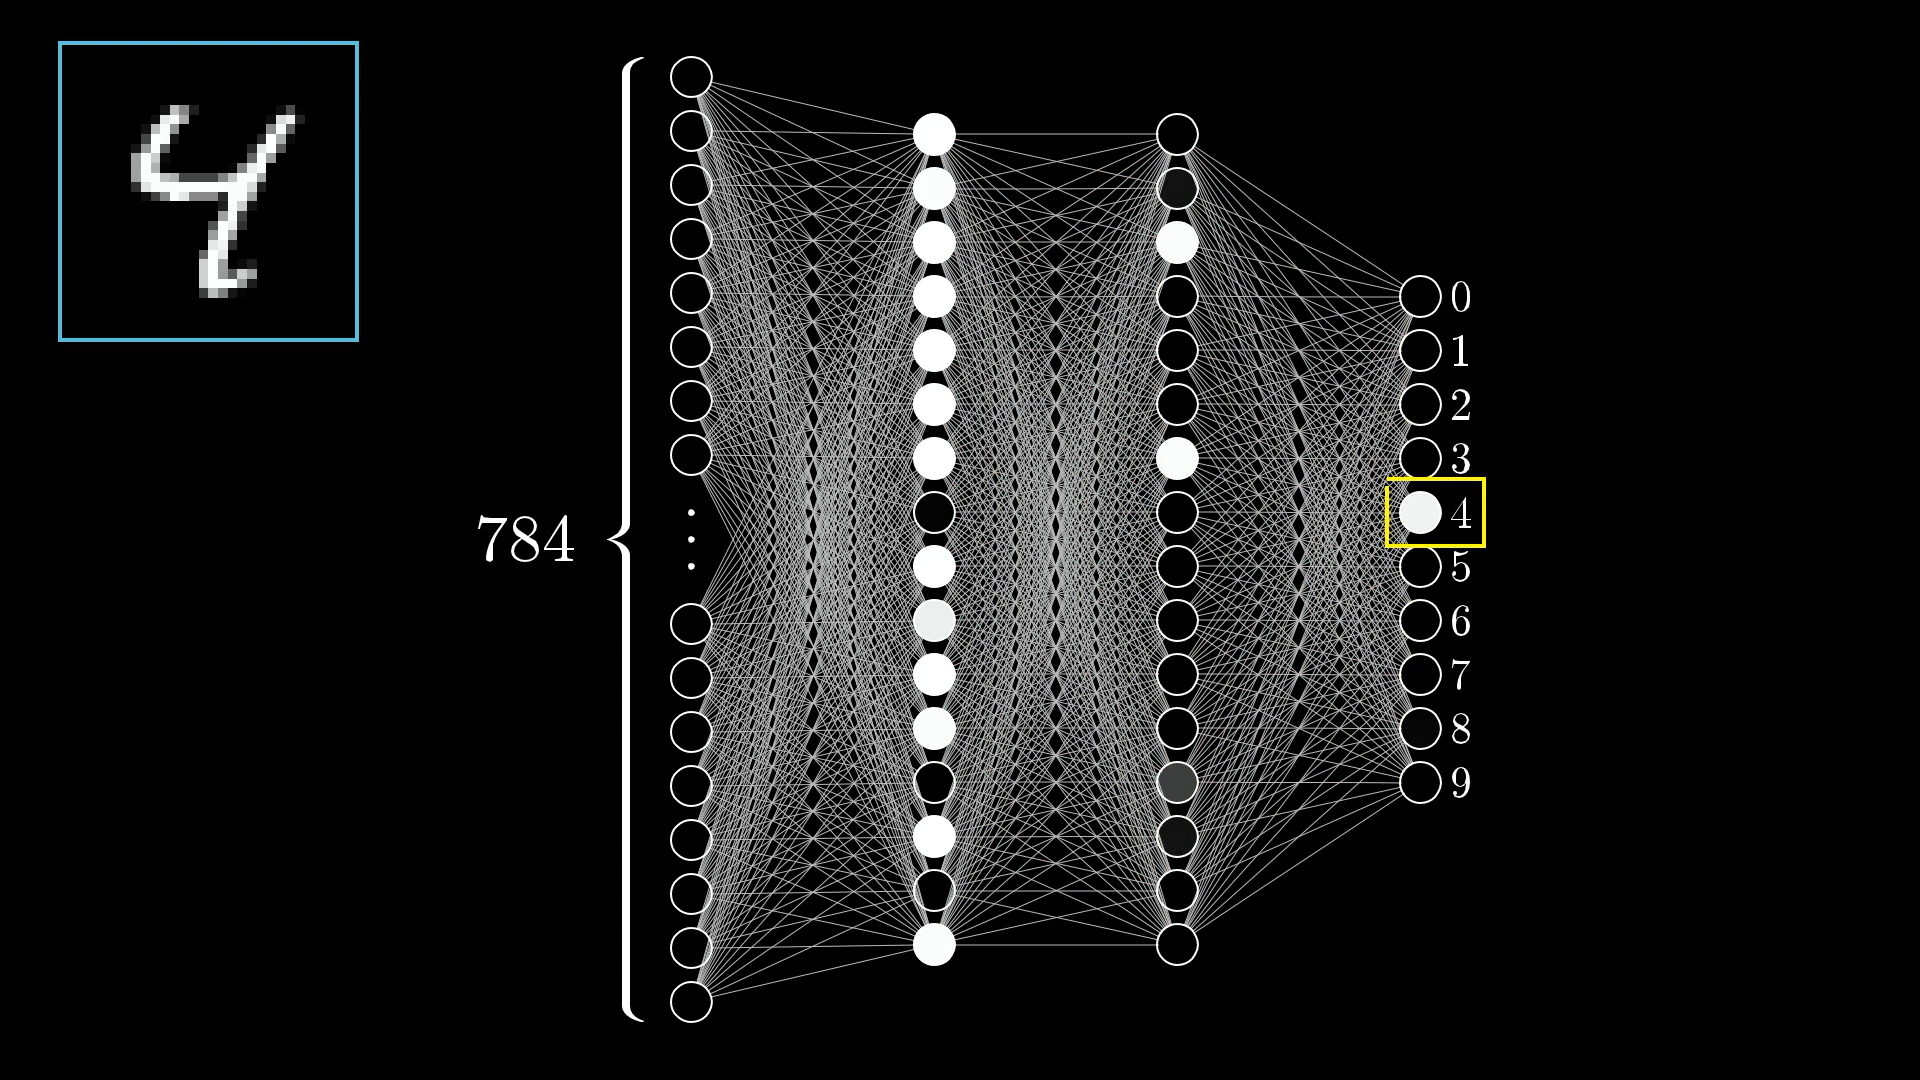
Each 28×28 pixel image becomes 784 input values (one for each pixel's brightness).
These flow through layers of neurons, each with weights and biases, to produce 10 outputs (one for each digit 0-9).
🤔 The Big Question: How Does Learning Happen?
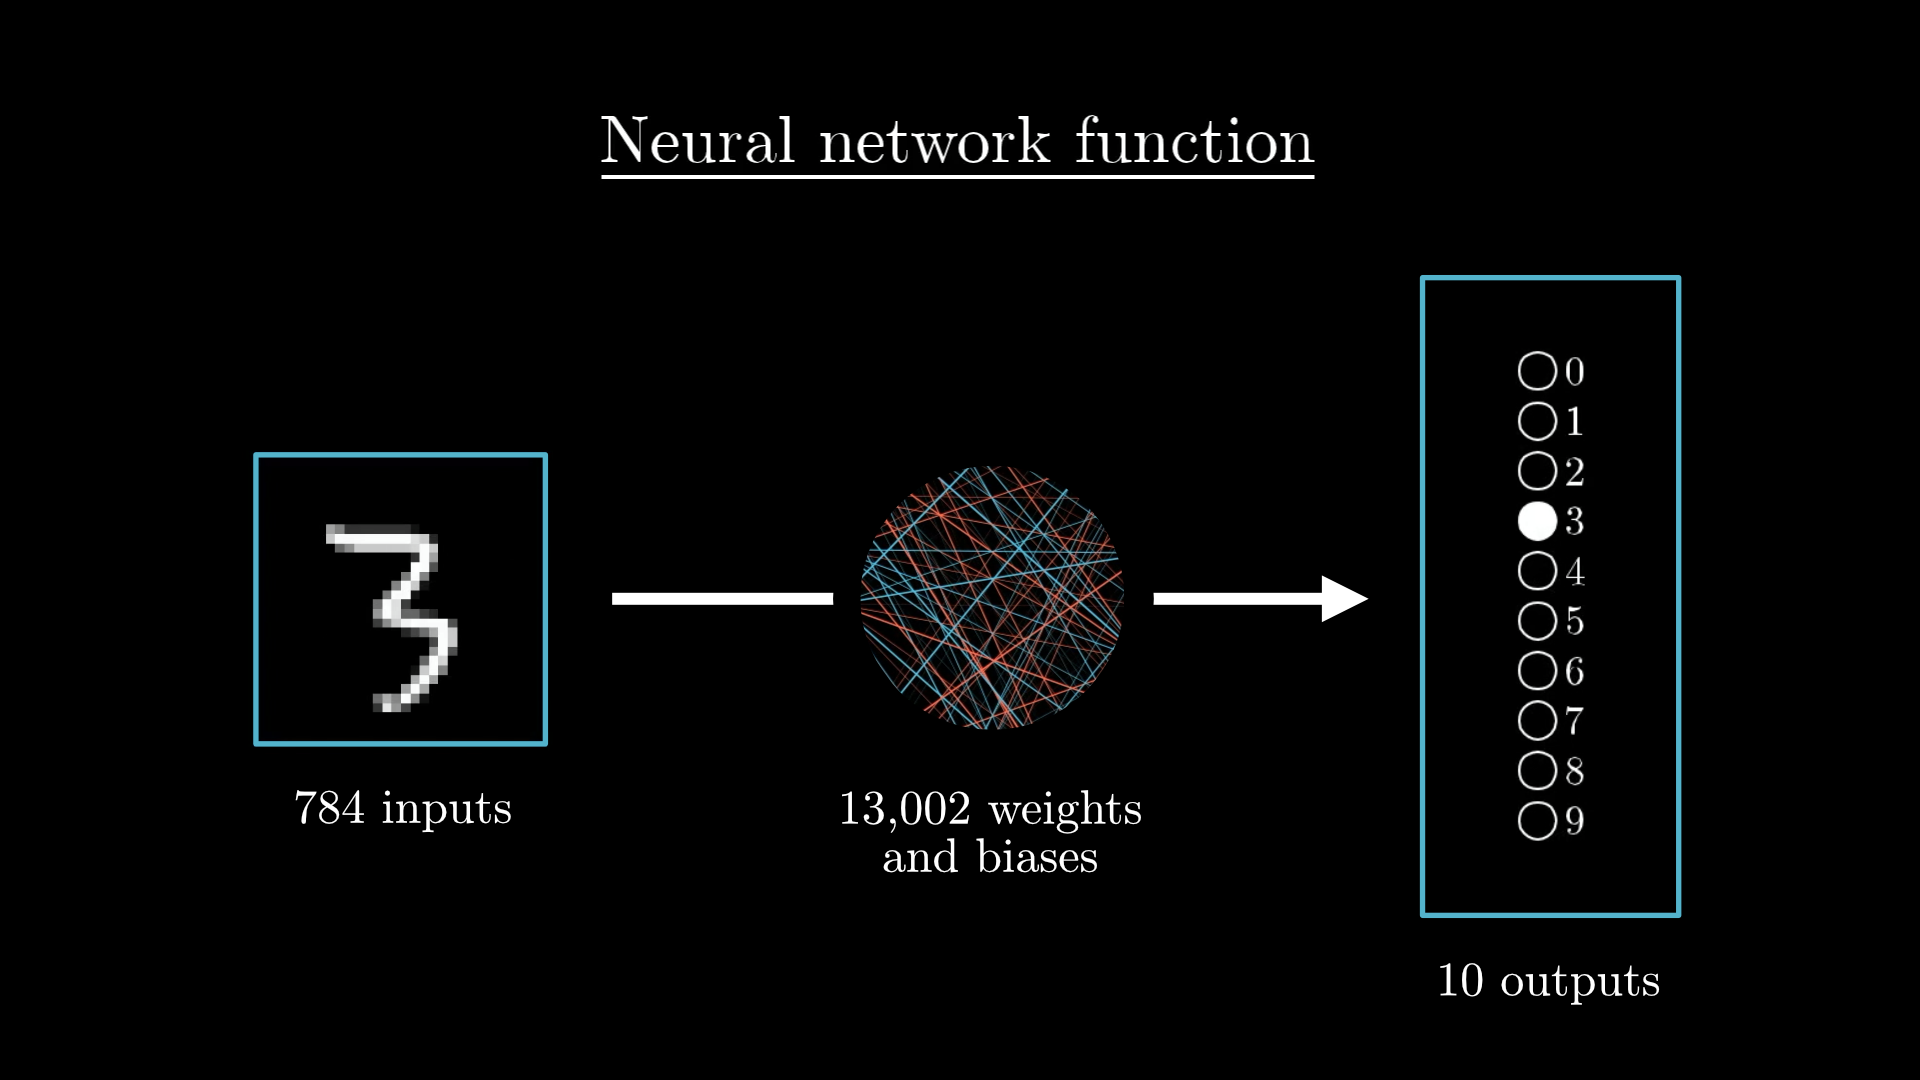
Our network has 13,002 parameters (weights and biases) that determine its behavior. Initially, these are just random numbers!
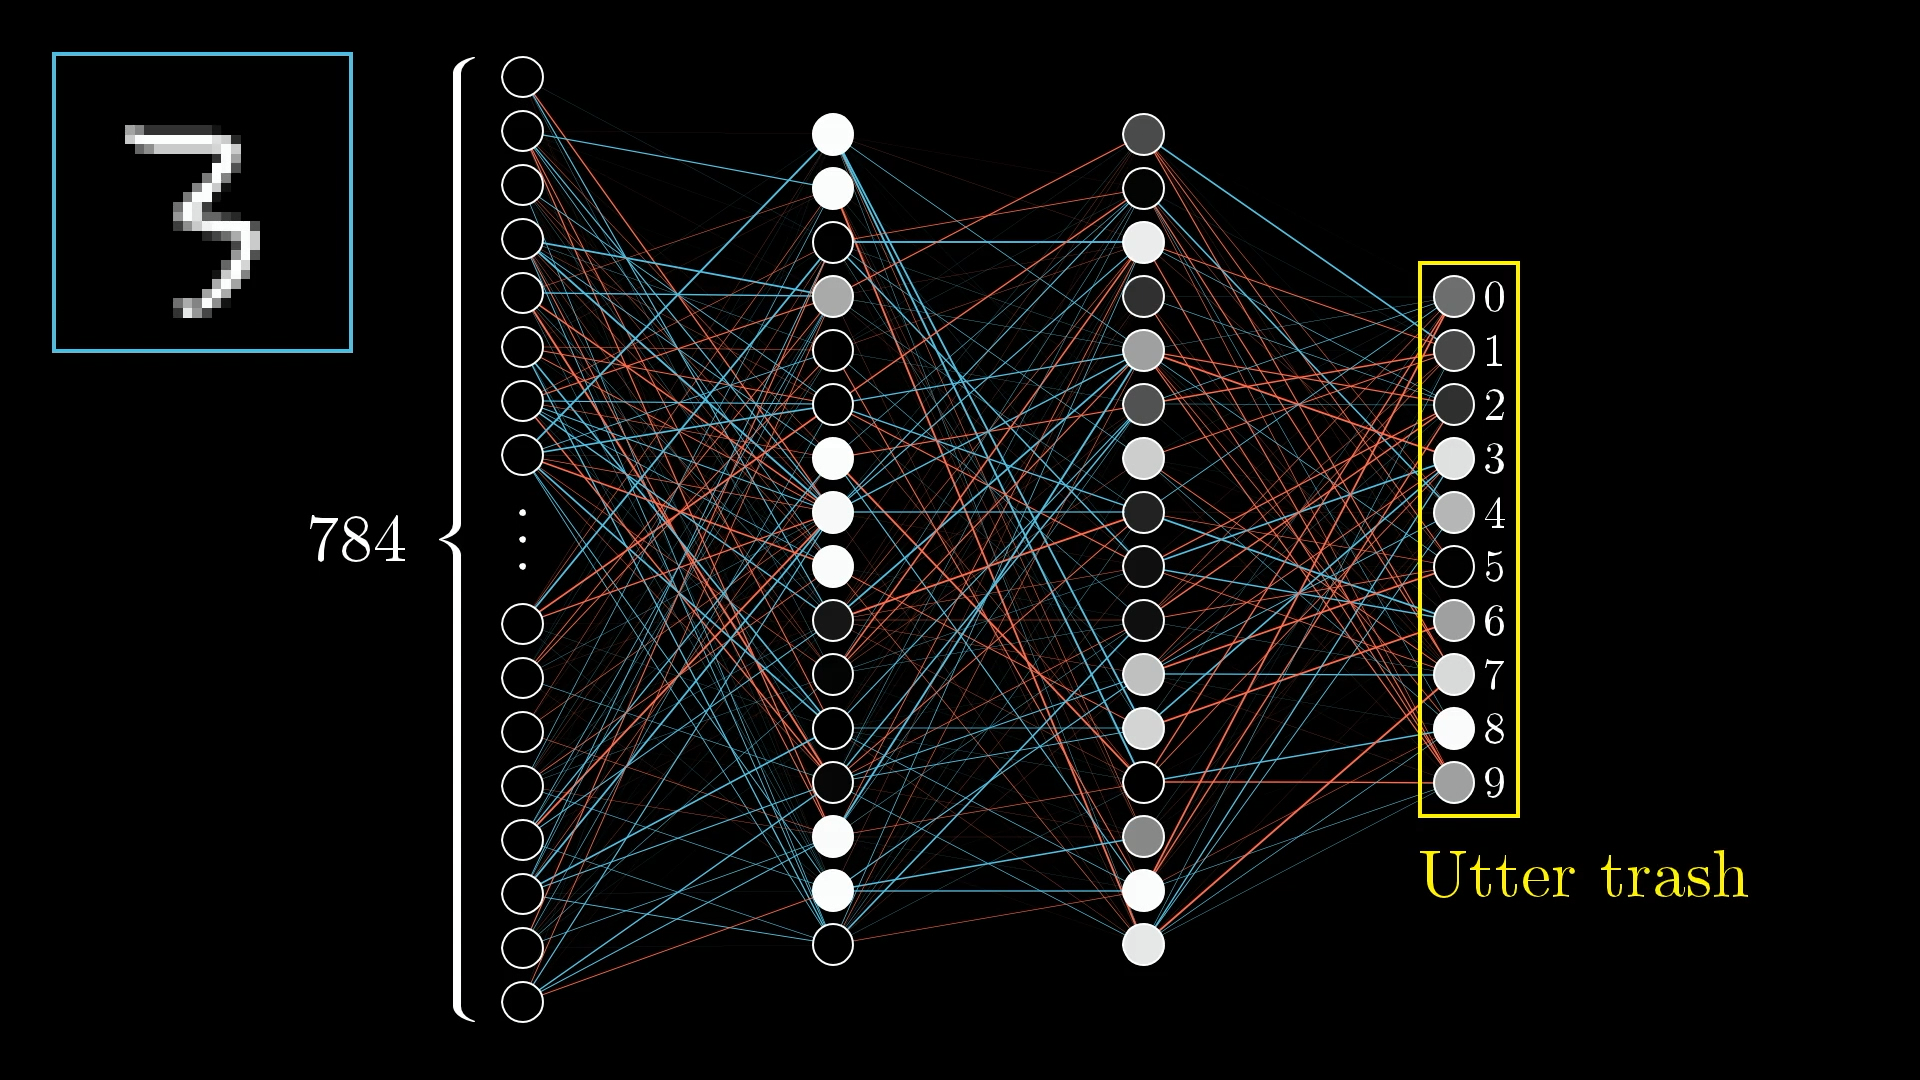
With random weights, our network produces "utter trash" 🗑️
💰 The Cost Function: Measuring How Bad We Are
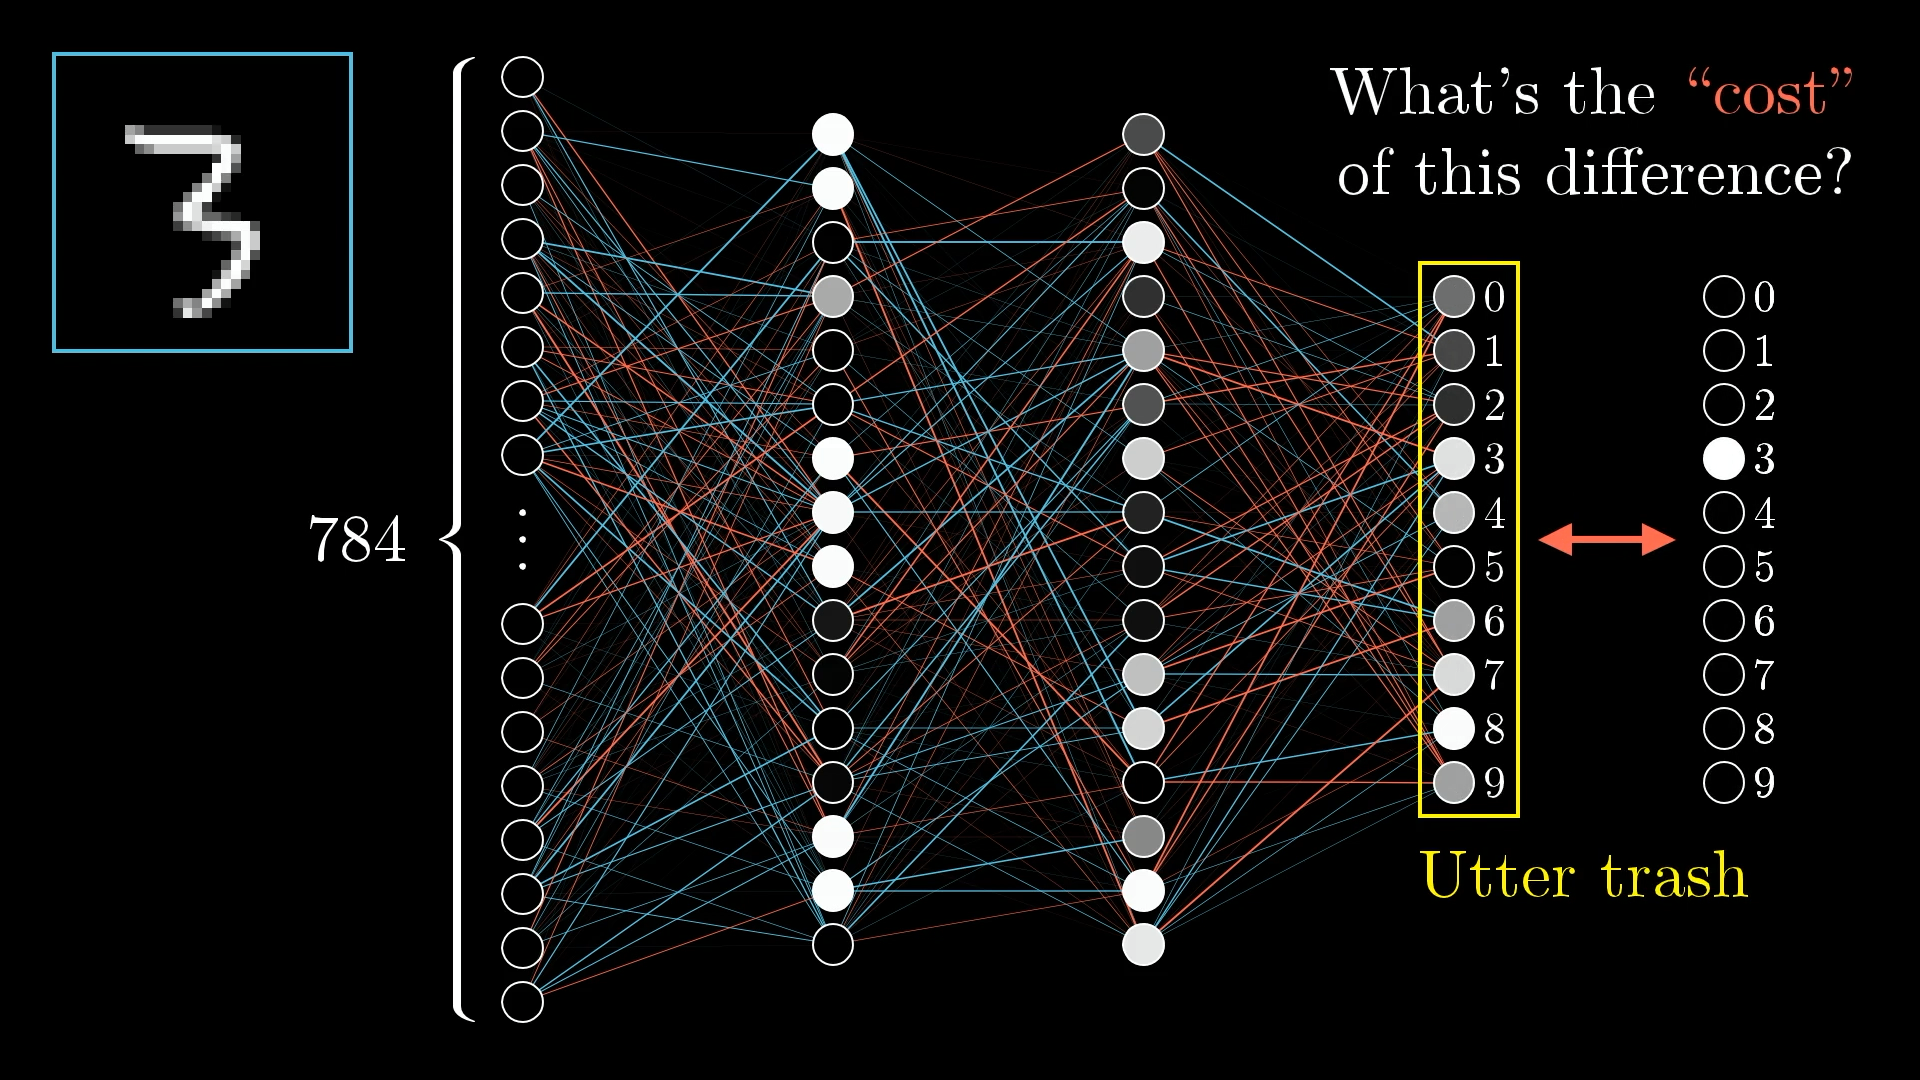
To improve, we first need to measure how badly our network is performing. This is where the cost function comes in!
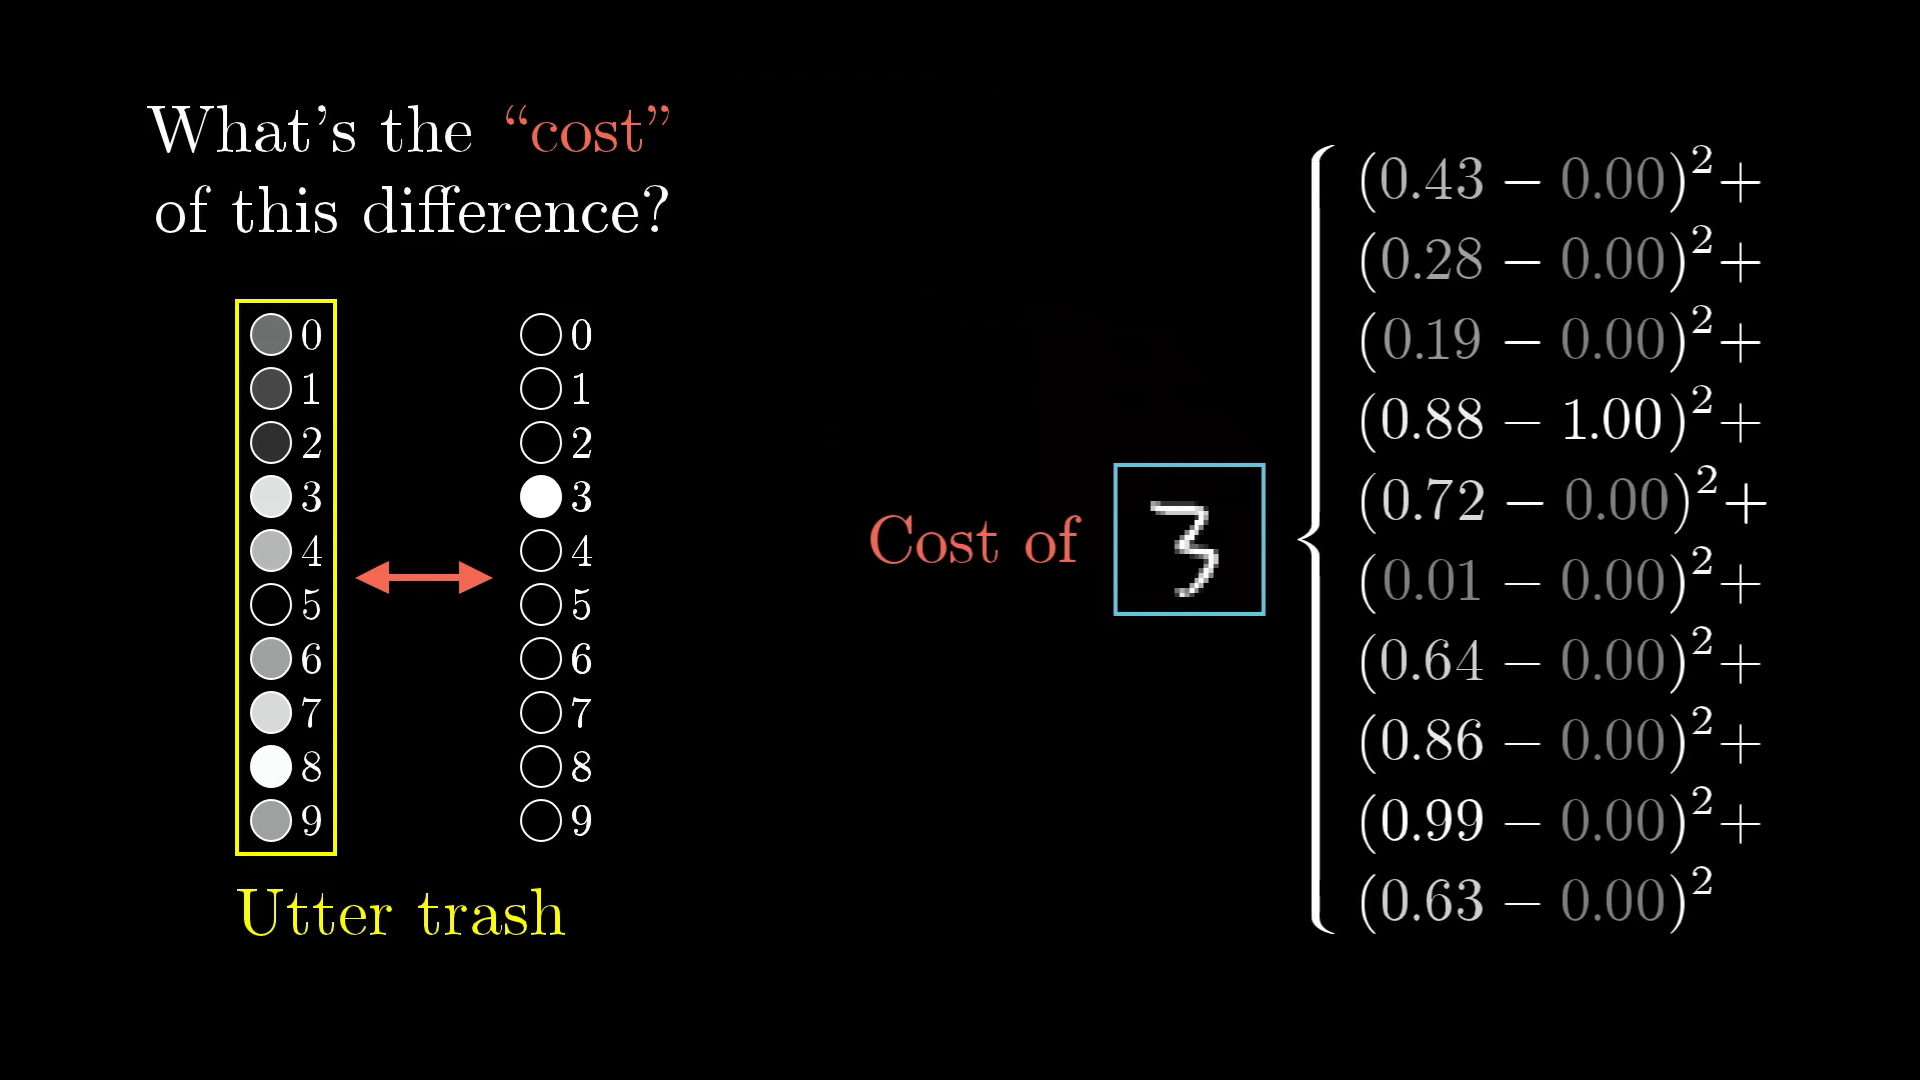
What's the cost of being wrong?
When we show our network a "3", we want the third output neuron to light up (value = 1) and all others to be dim (value = 0).
The cost measures how far we are from this ideal.
📊 Understanding the Cost Function
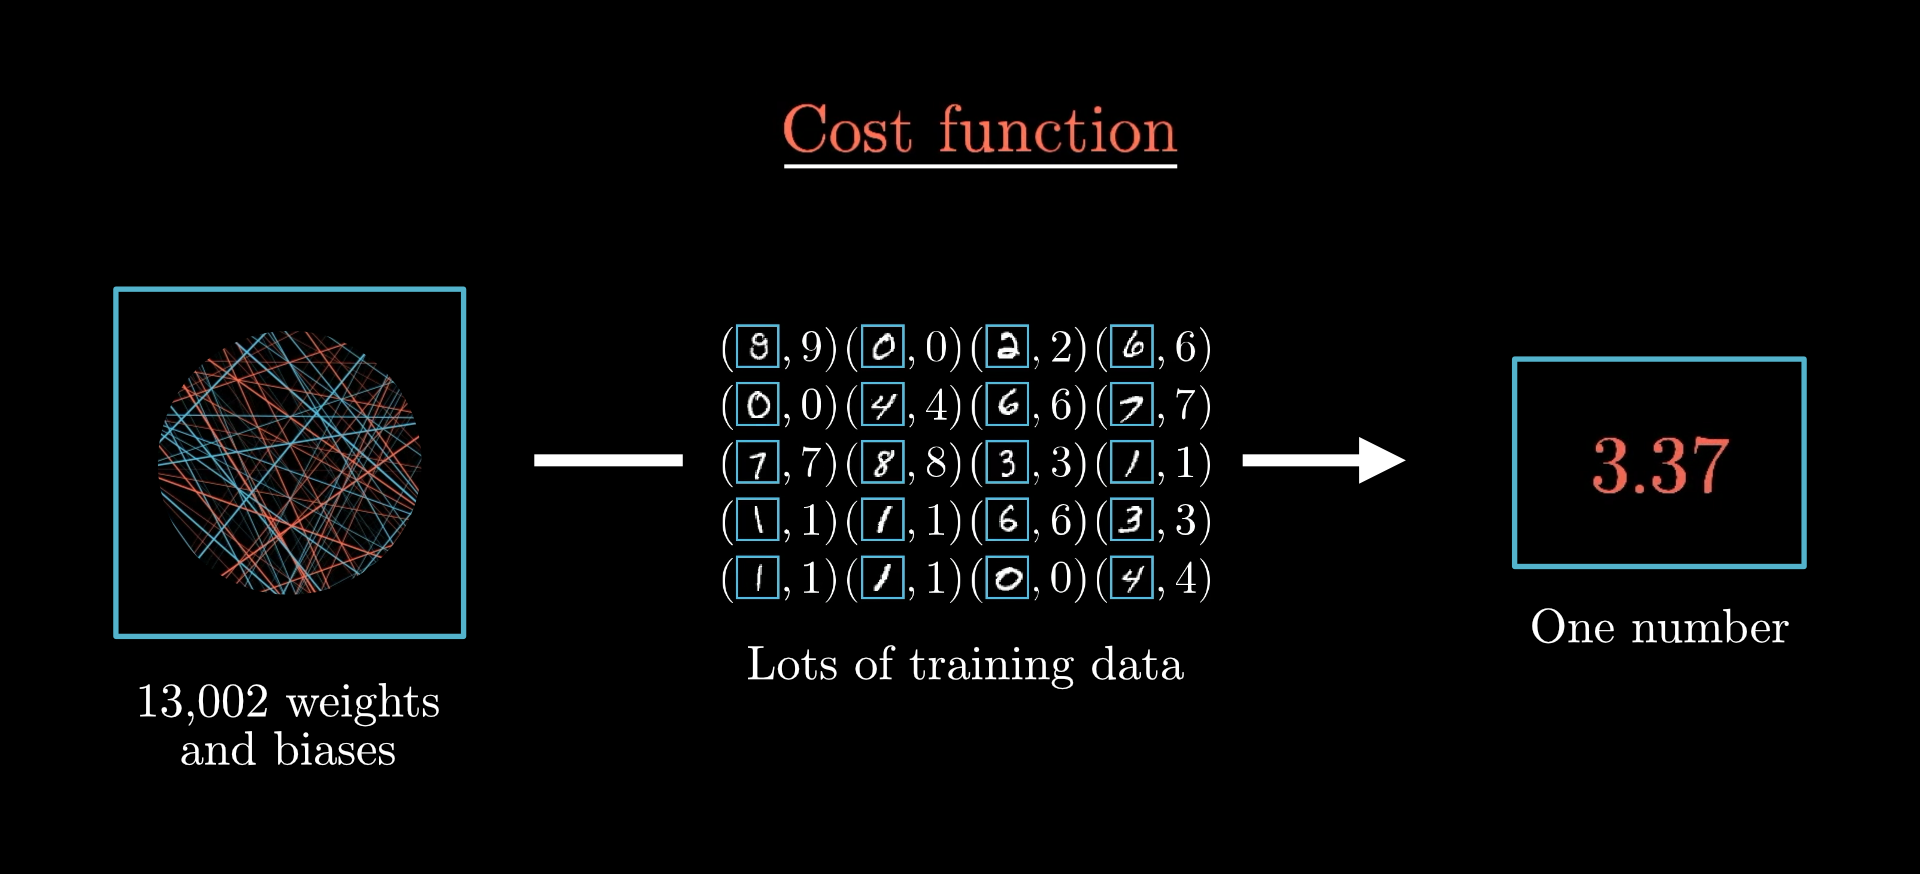
A low cost means the network is doing well. A high cost means it's making lots of mistakes.
🎯 Interactive Question
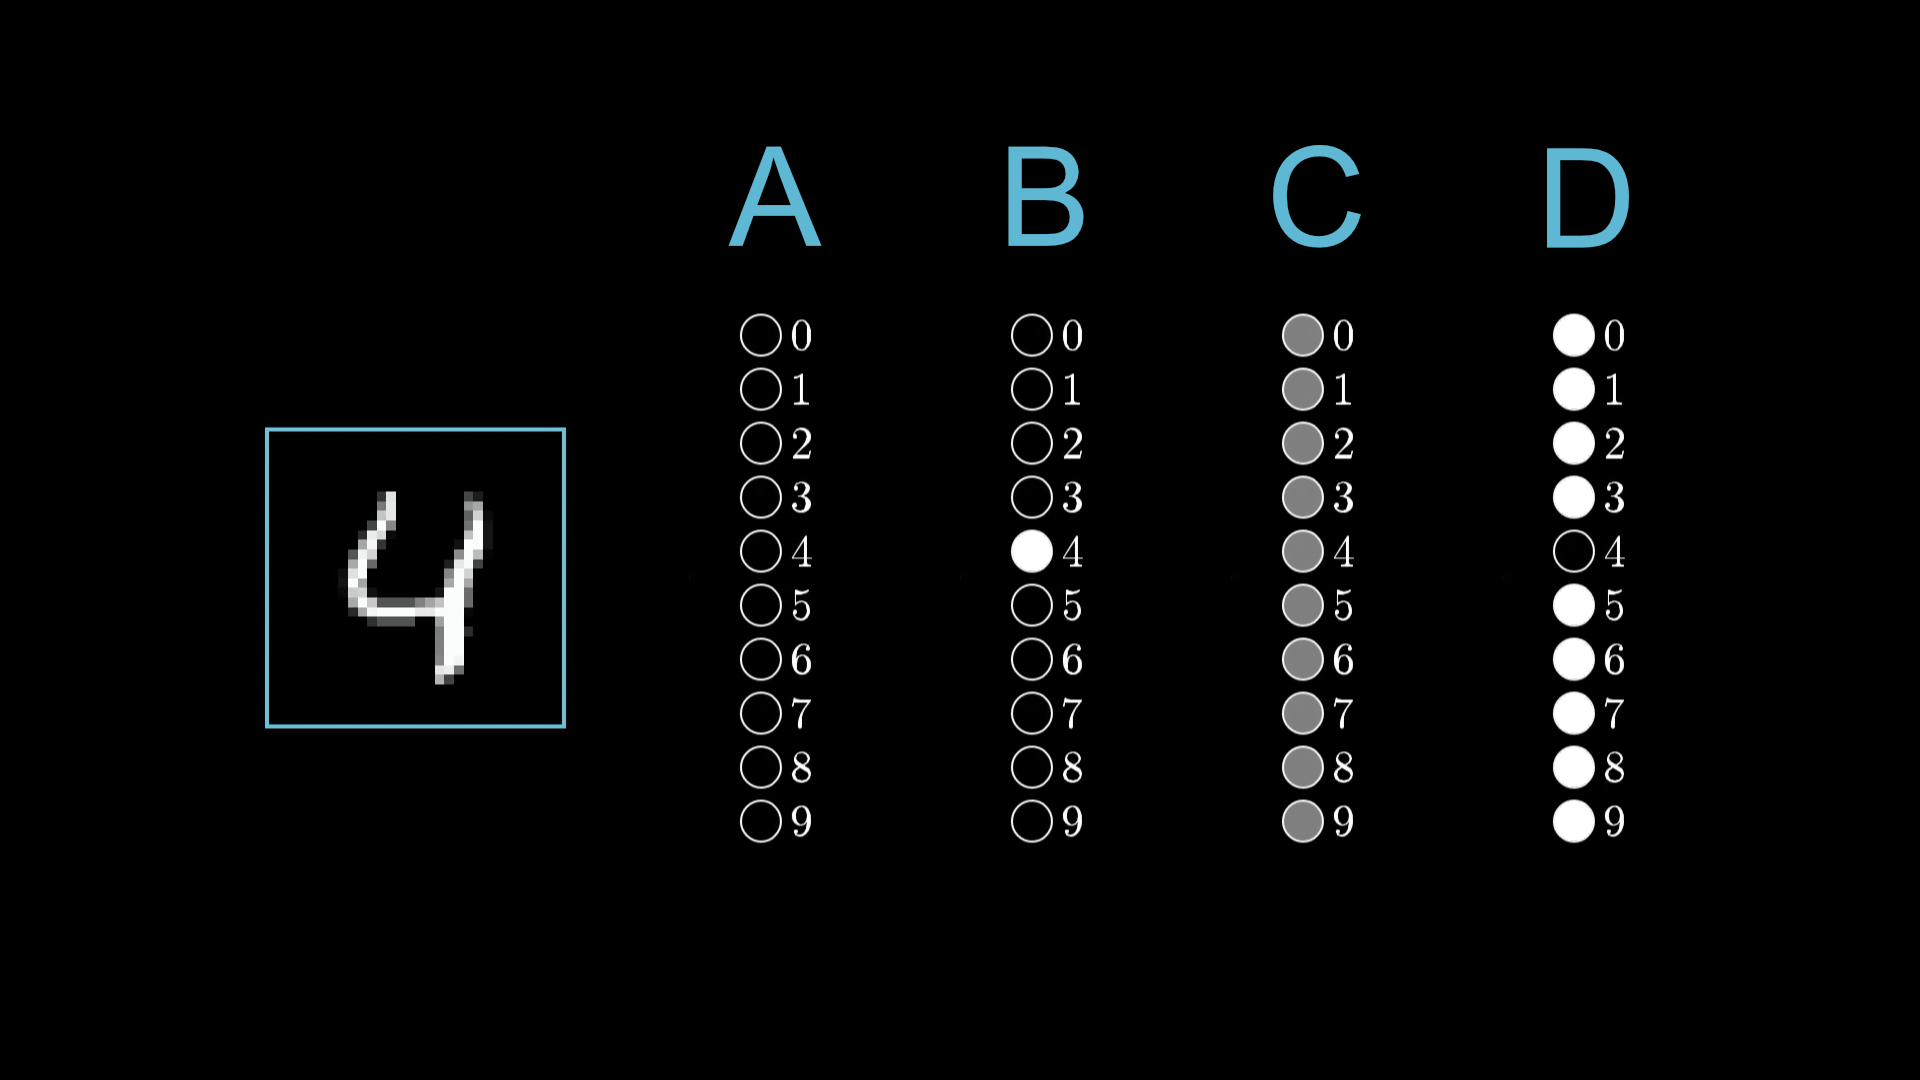
Can you rank these outputs from highest cost to lowest cost for classifying a "4"?
⬇️ The Minimization Challenge
Now we have a clear goal: Find the values of our 13,002 parameters that minimize the cost function.
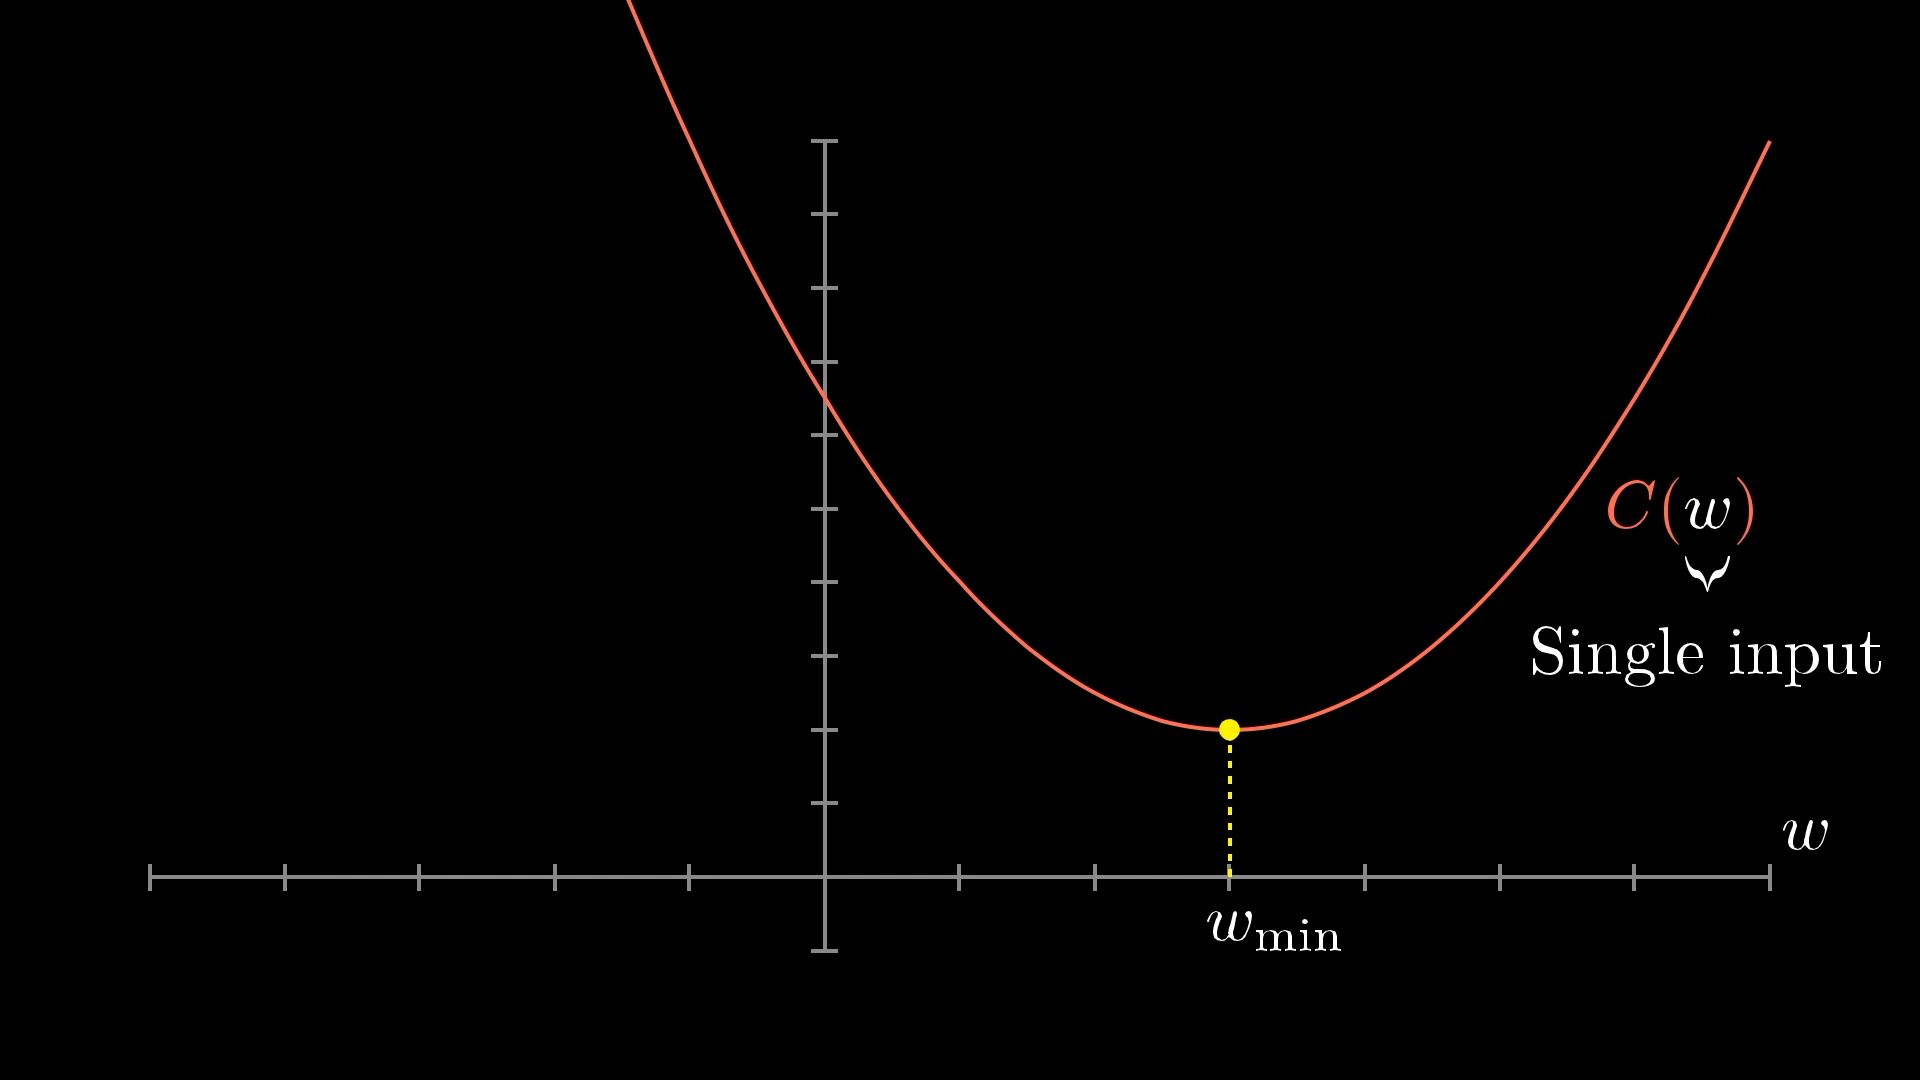
Let's Start Simple
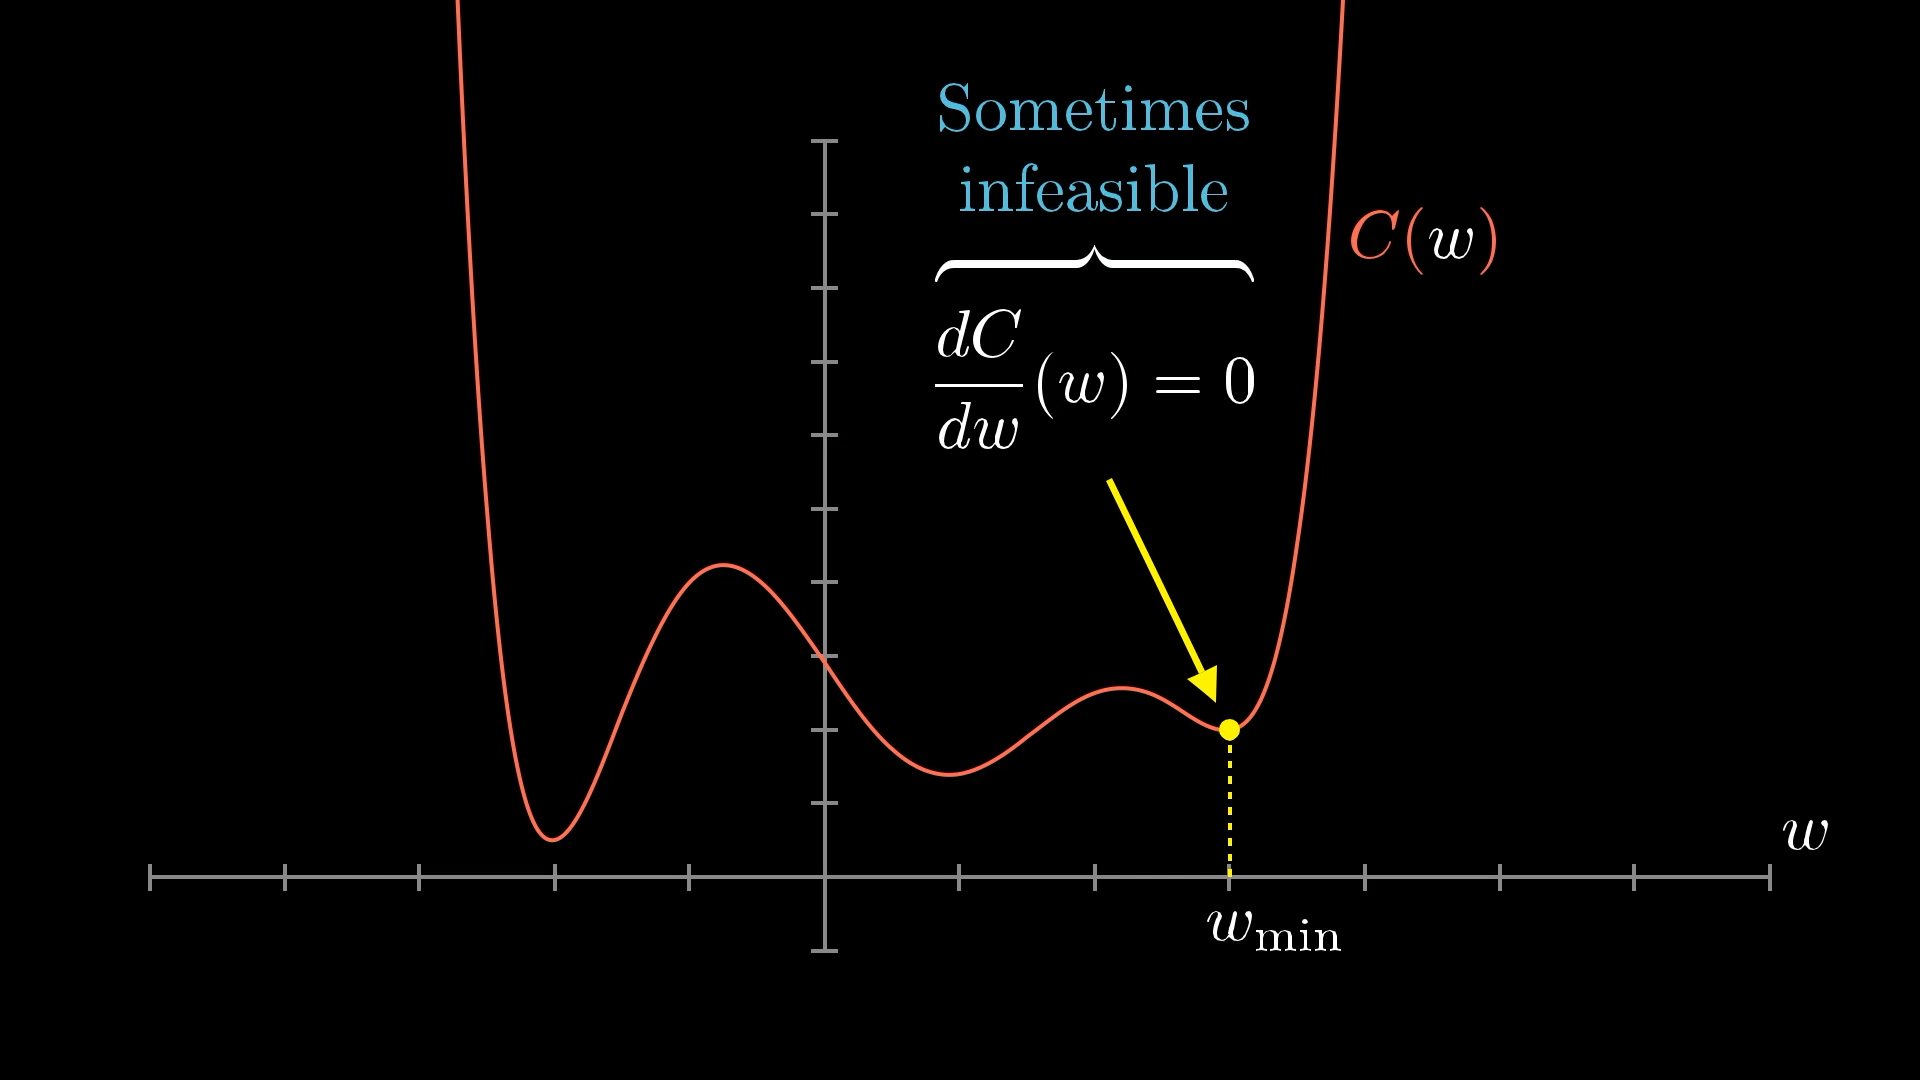
Imagine we only have ONE parameter to optimize. Our cost function would look like a simple curve, and we want to find its minimum.
For very simple functions, we could solve this mathematically (find where slope = 0).
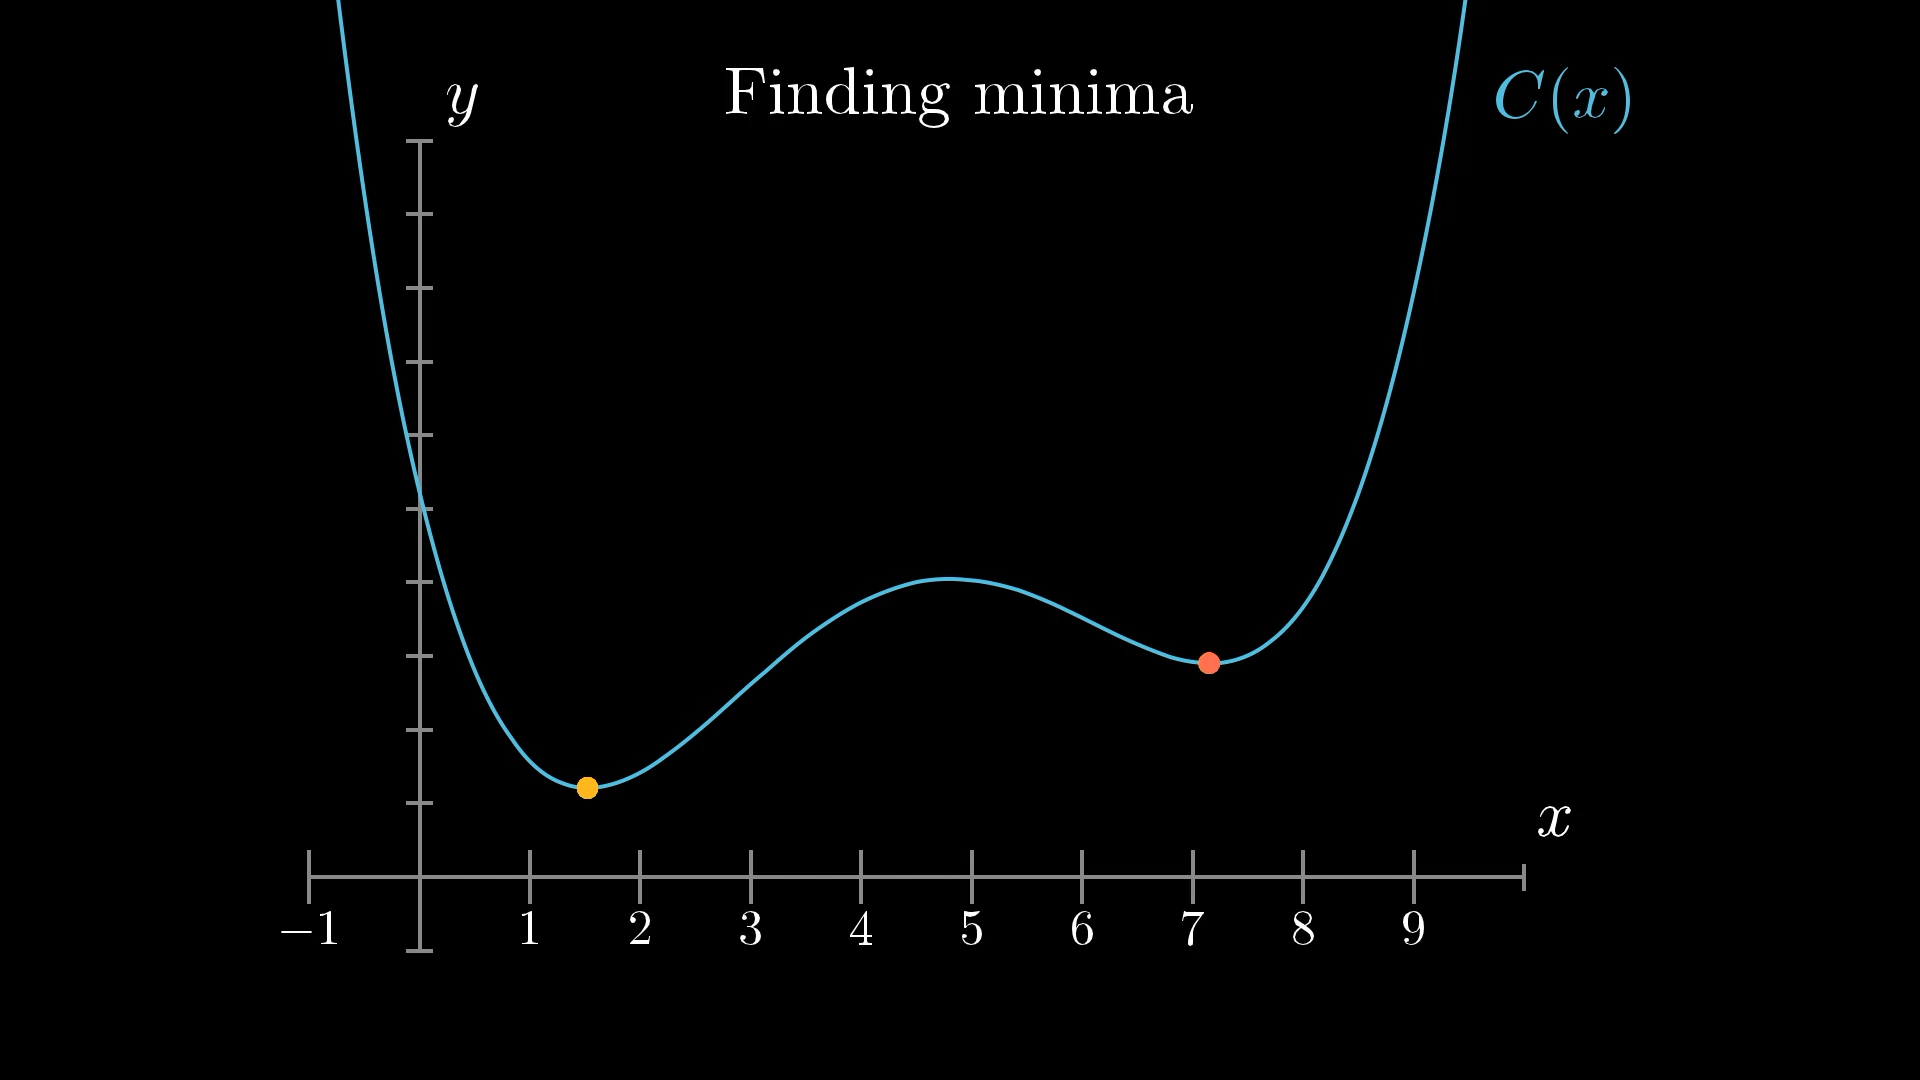
🏔️ Enter Gradient Descent: Rolling Downhill

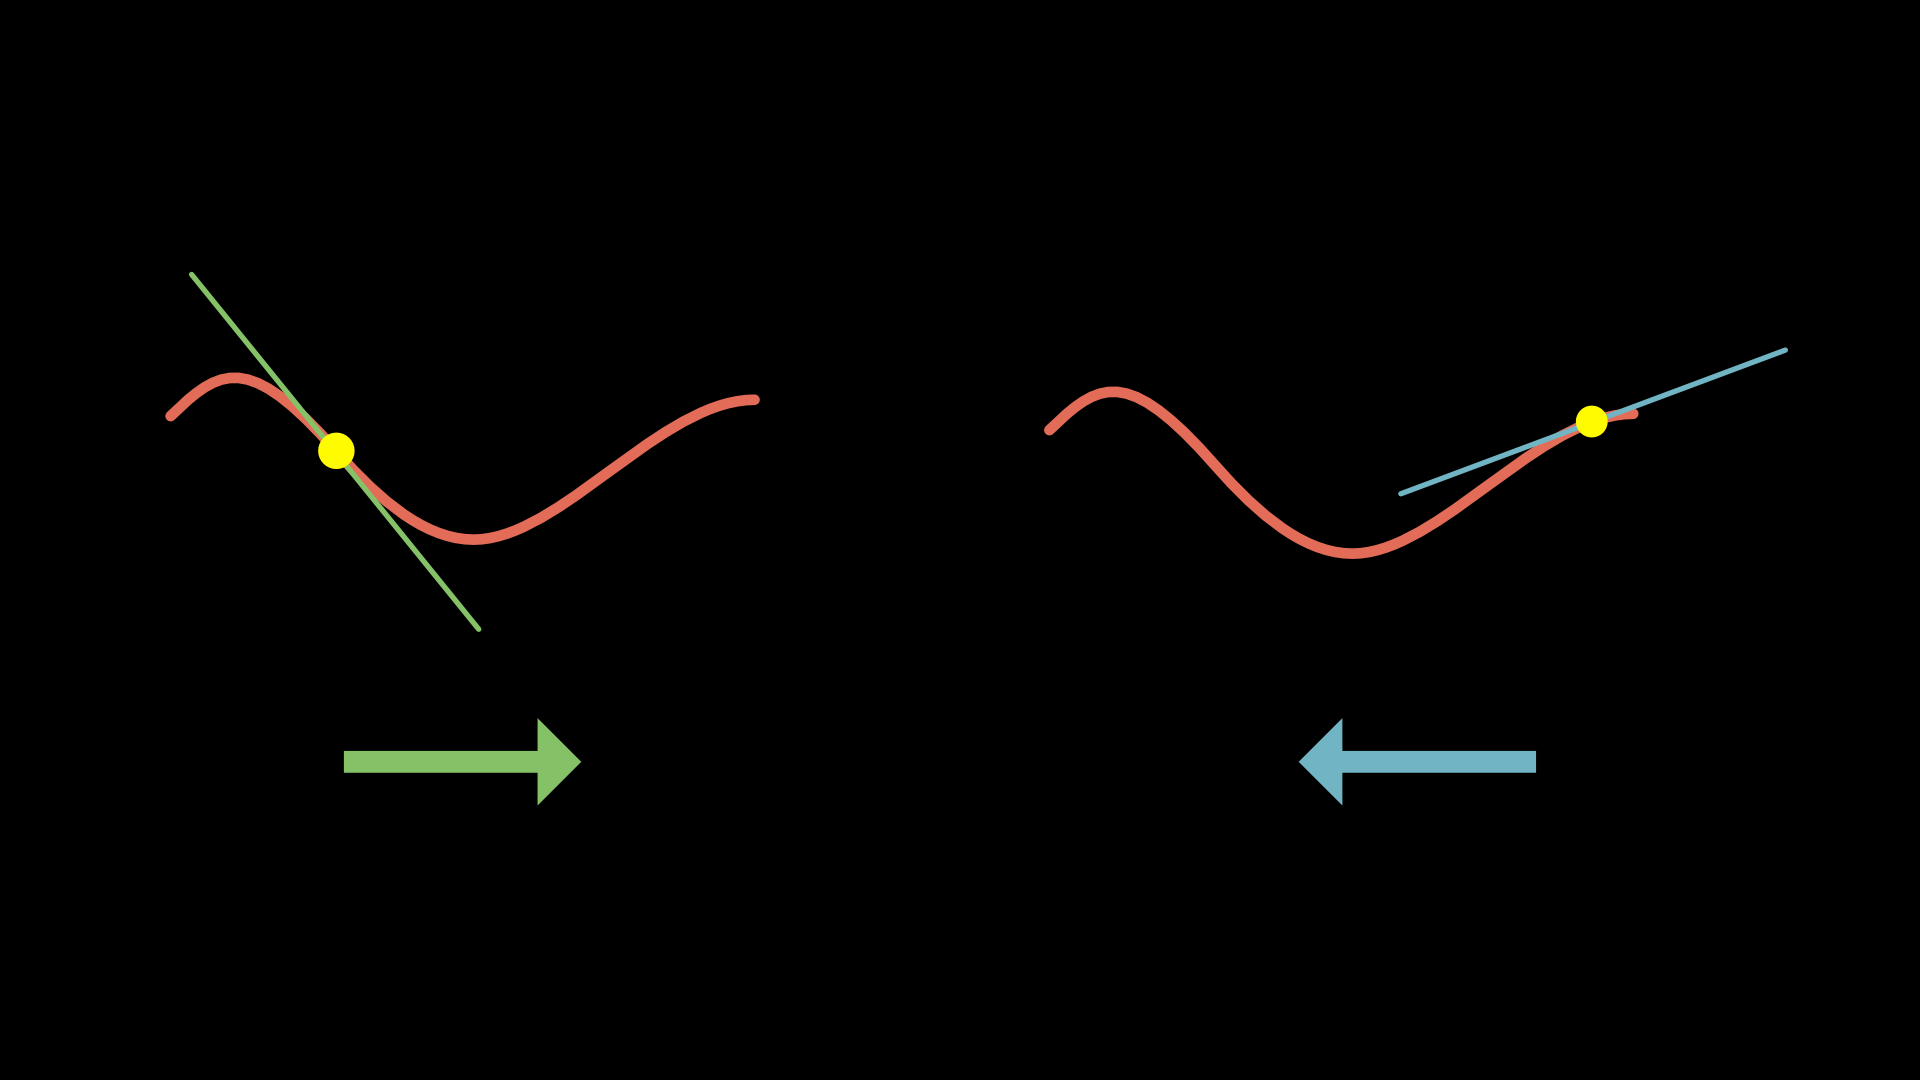
The Algorithm (1D version)
- Start at a random point
- Check the slope:
- If slope is positive → move left
- If slope is negative → move right
- Take a small step in that direction
- Repeat until you reach the bottom!
🗺️ Scaling Up: Two Dimensions
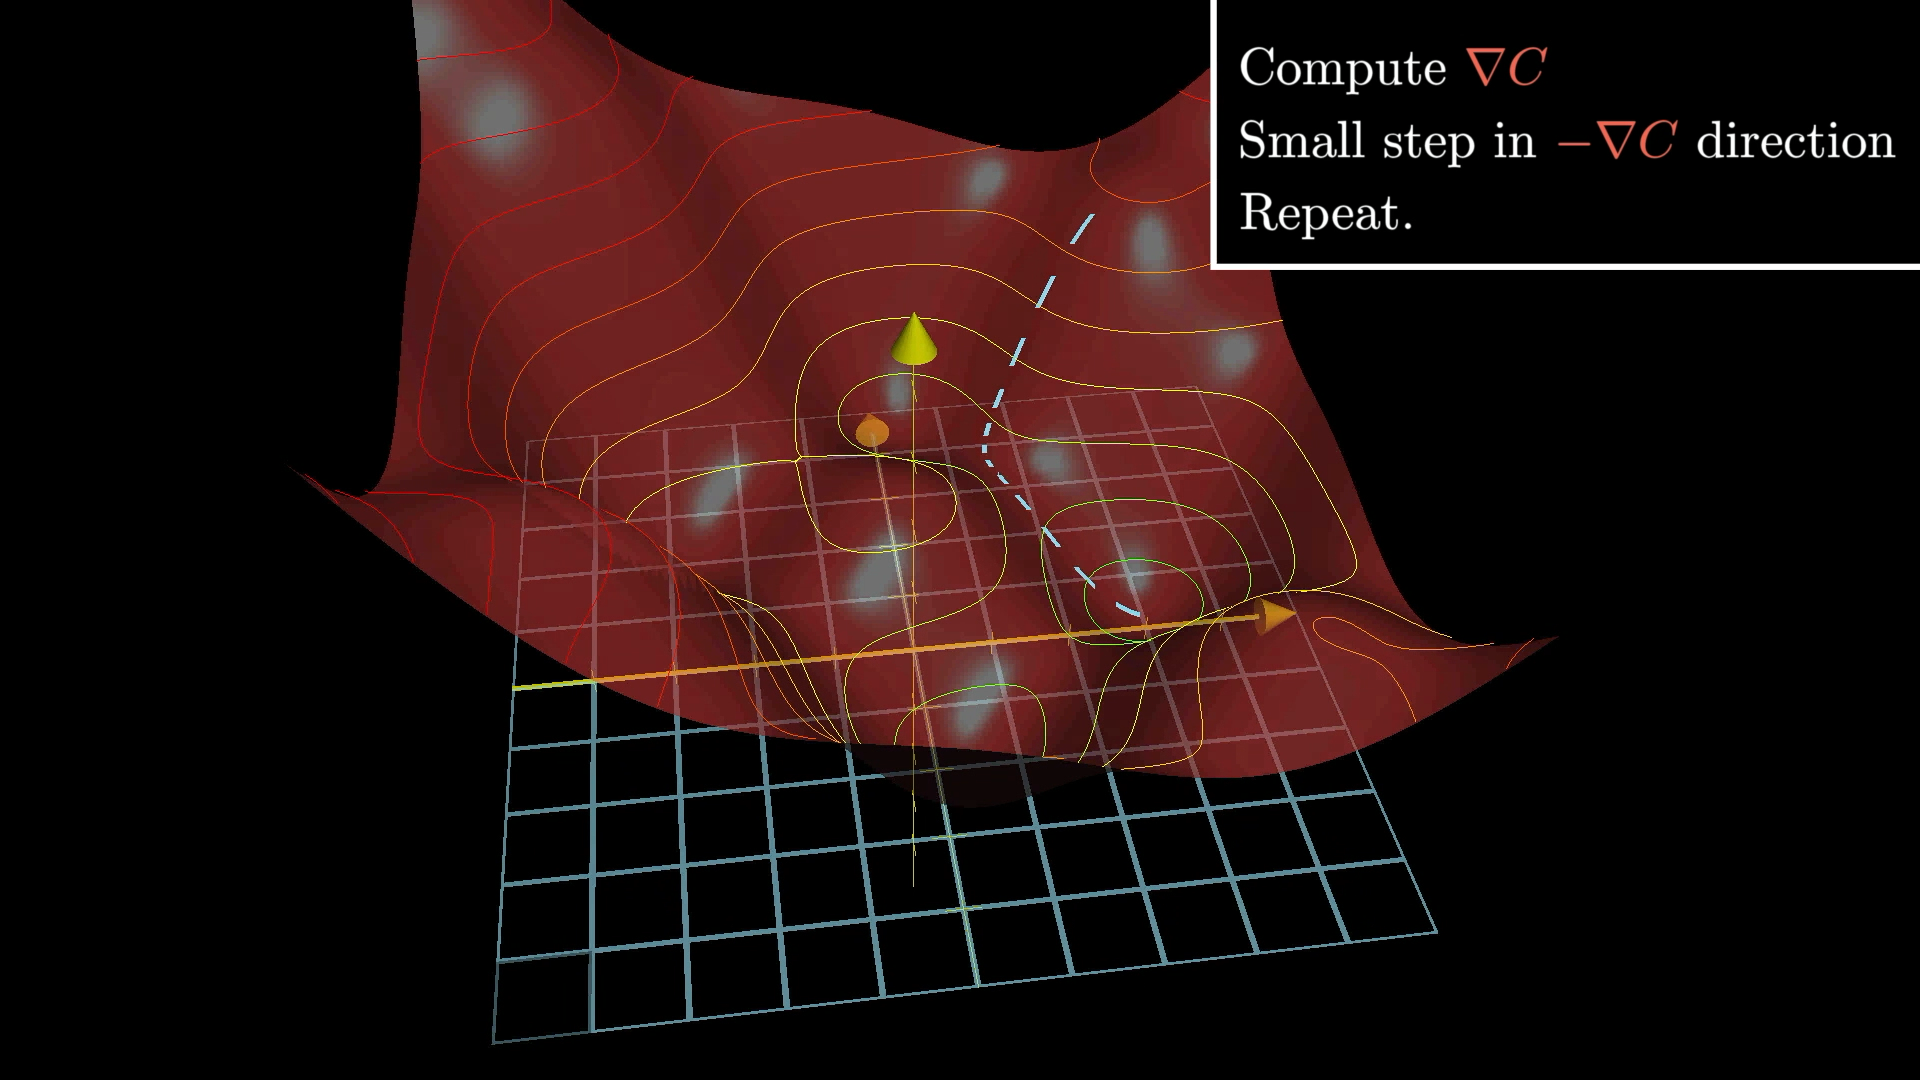
Now imagine our cost function has two inputs instead of one. We can visualize this as a landscape with hills and valleys.
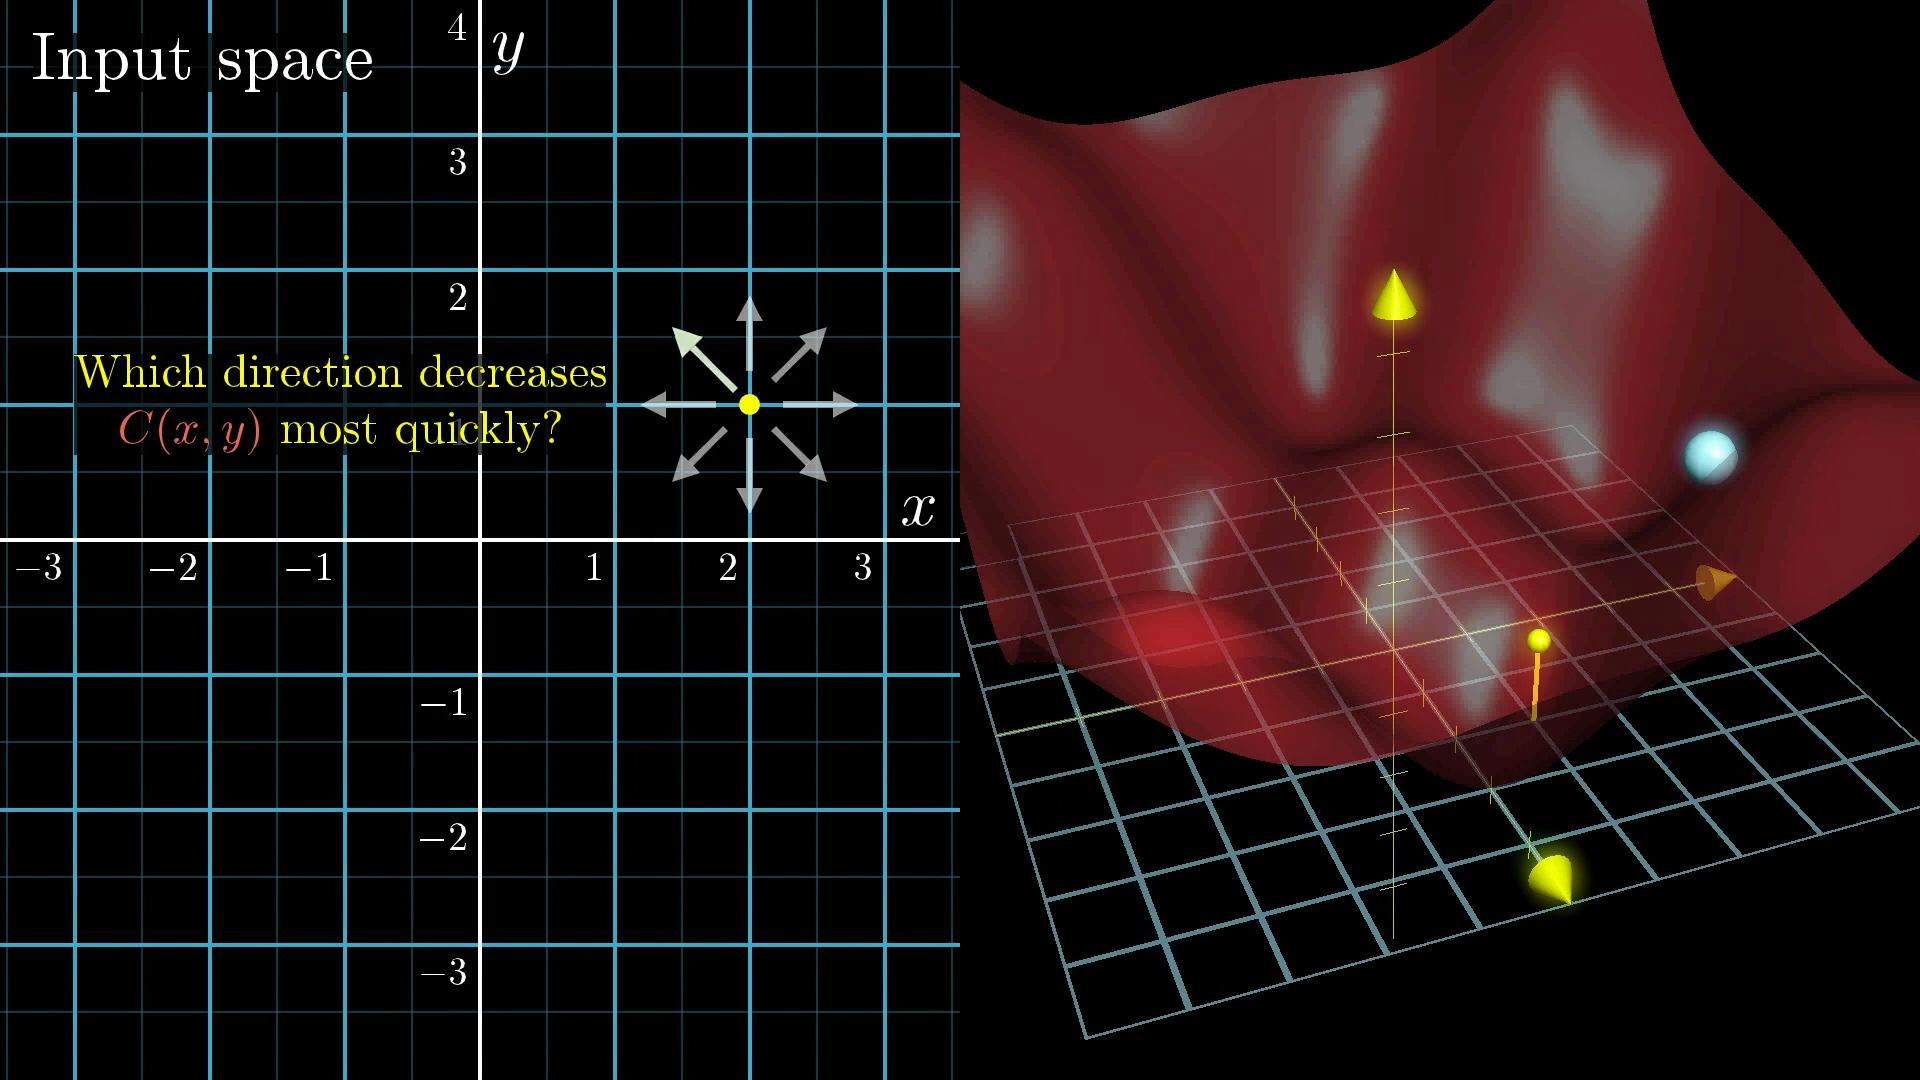
The Gradient Vector
In multiple dimensions, "slope" becomes a vector called the gradient.
The gradient points in the direction of steepest ascent, so the negative gradient points downhill!
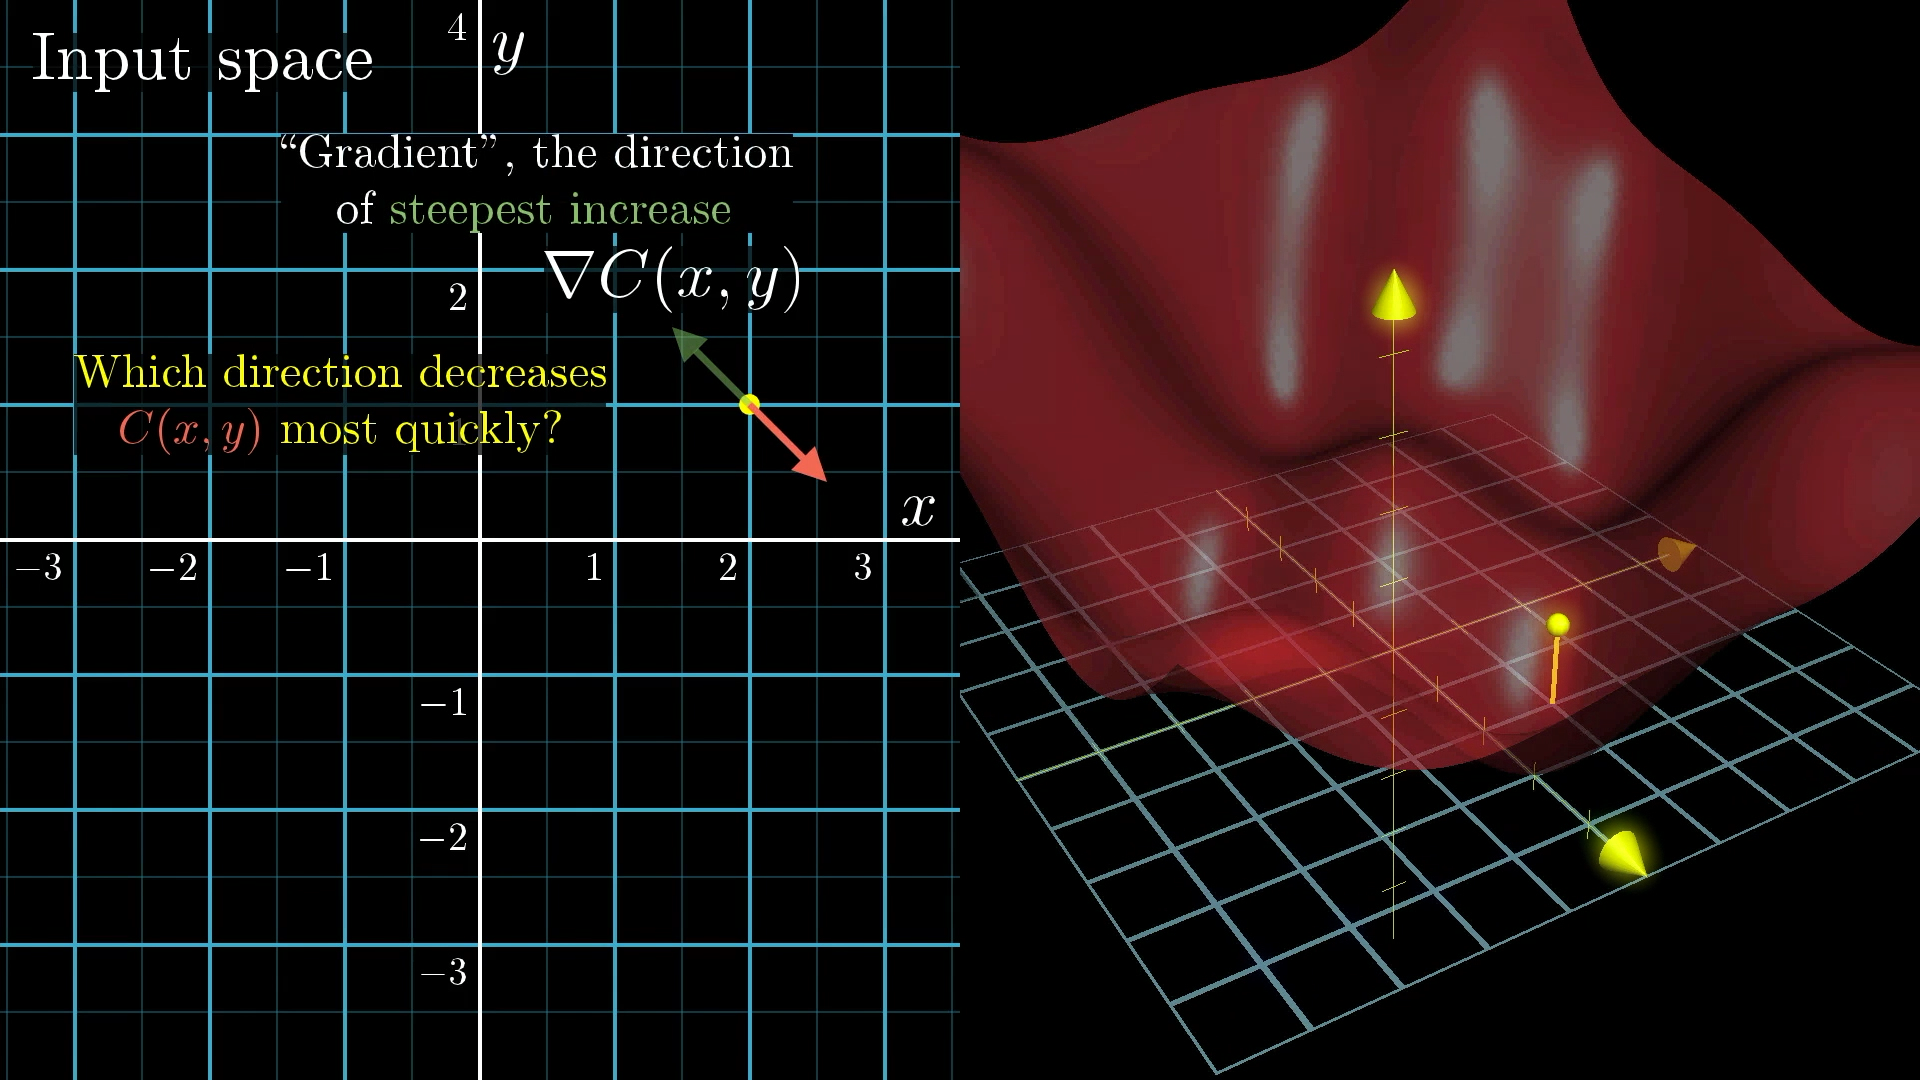
Negative Gradient: -∇C (points downhill)
🎯 Following the Gradient Path
1. Compute the gradient ∇C
2. Move in the opposite direction: -η∇C
3. Repeat until convergence
🌌 Thinking in 13,002 Dimensions
The same principle works in our actual problem with 13,002 dimensions, even though we can't visualize it!
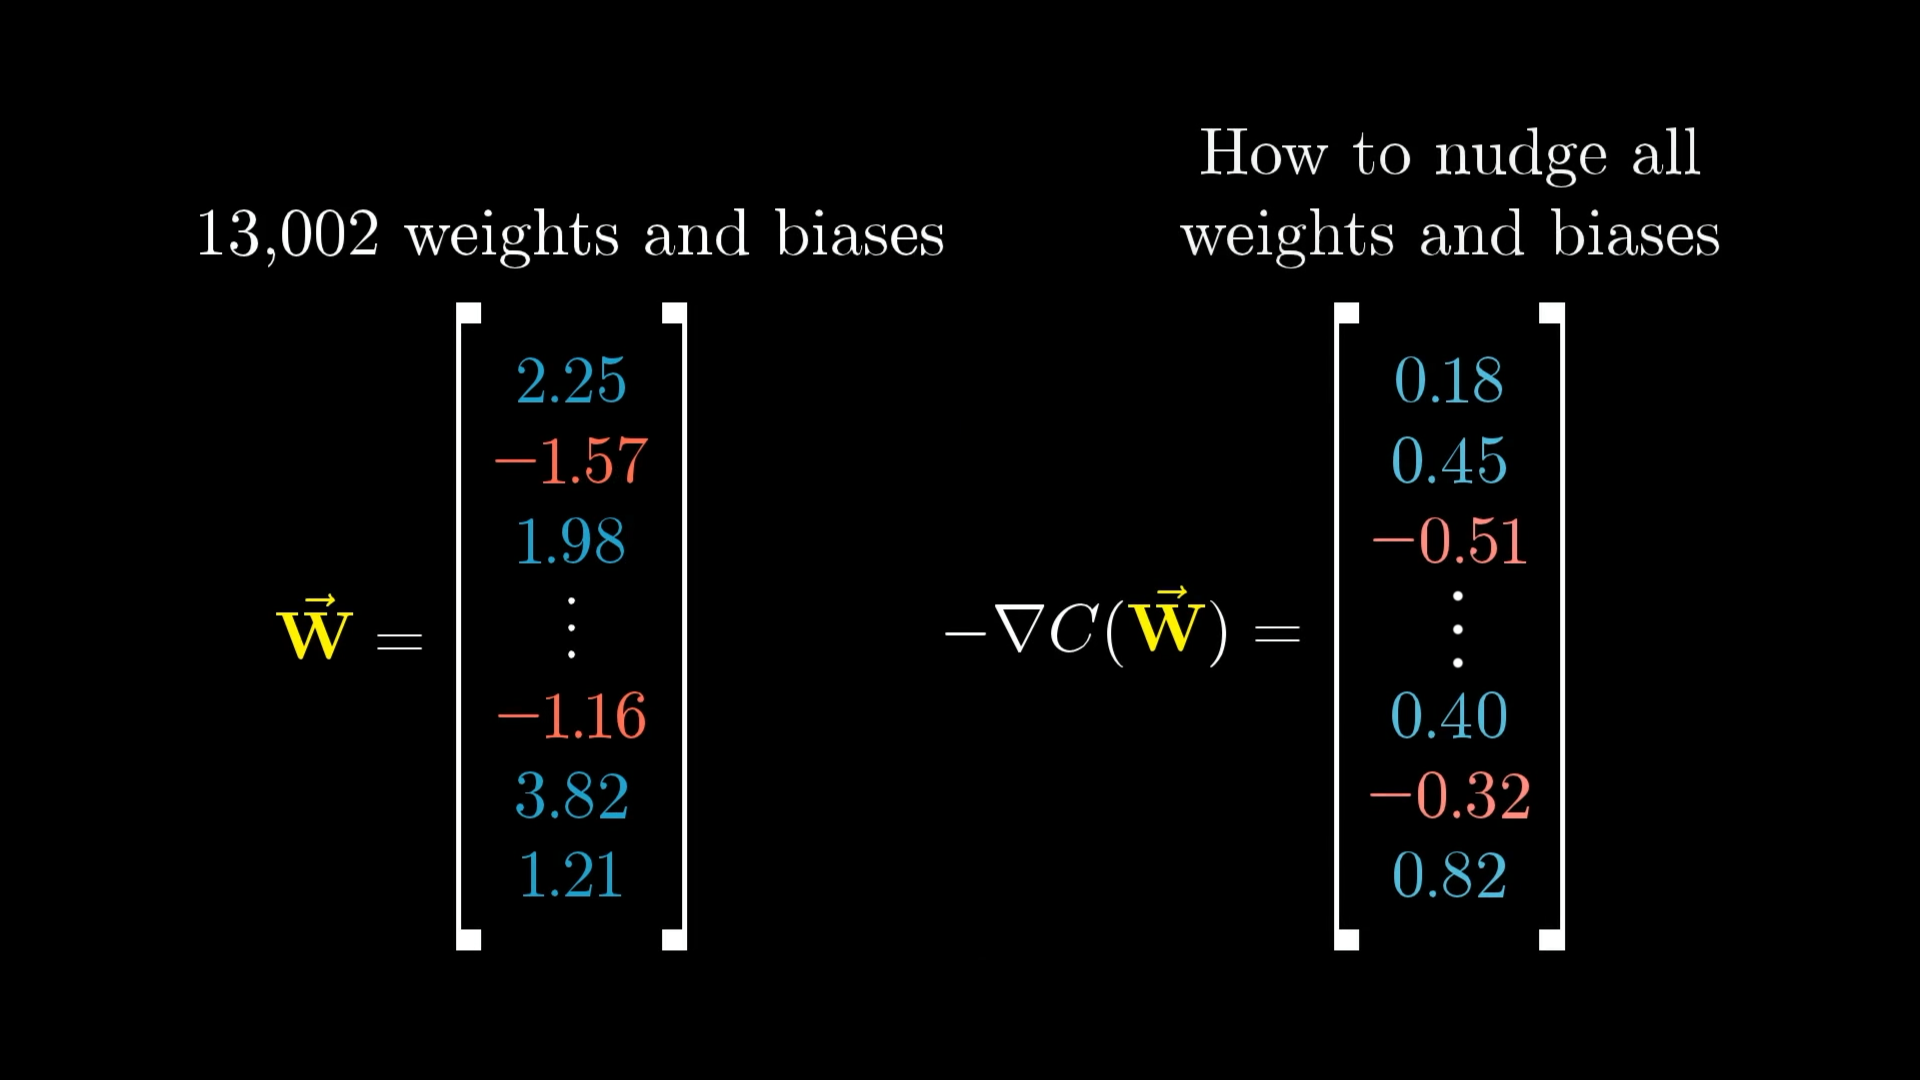
Vector Perspective
Think of all weights and biases as one giant vector with 13,002 components.
The gradient is also a vector with 13,002 components, telling us how to nudge each parameter.
- Direction: Should this weight increase or decrease?
- Magnitude: How important is changing this particular weight?
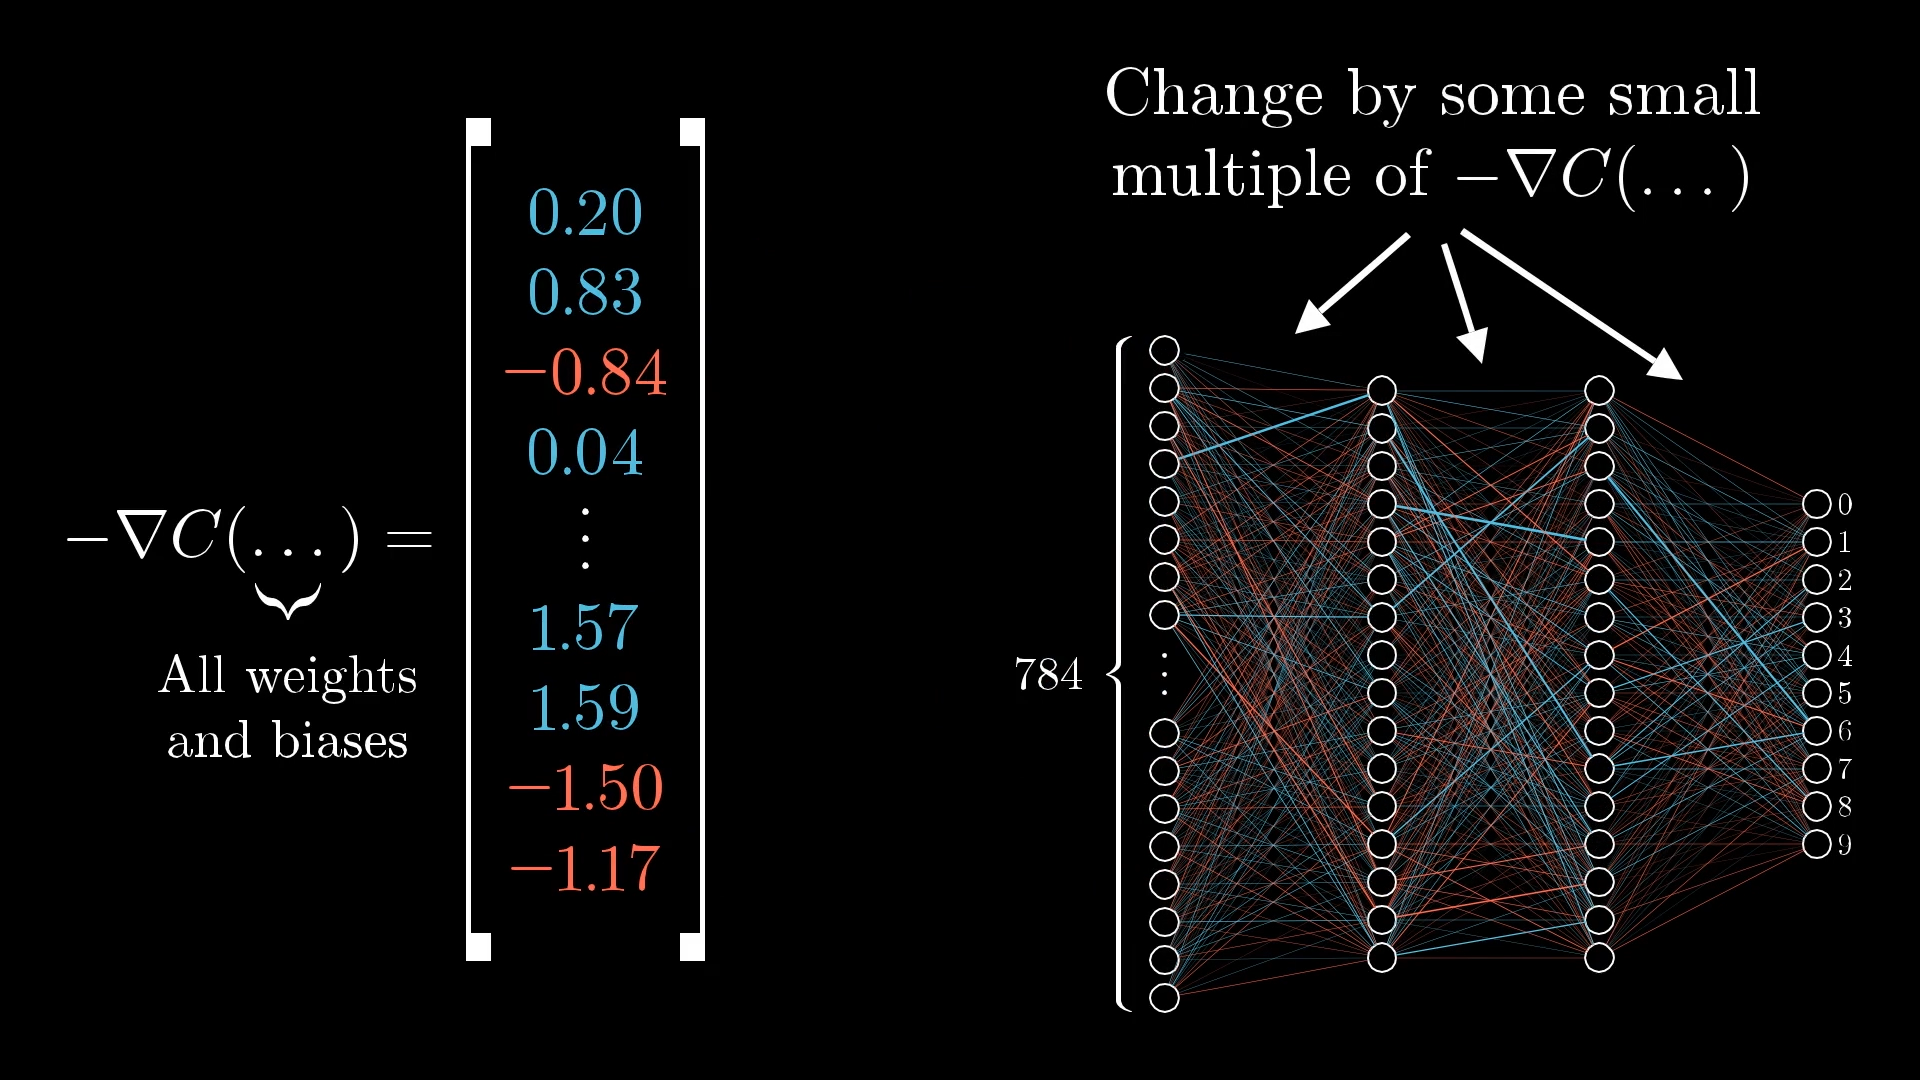
⚖️ Not All Weights Are Created Equal
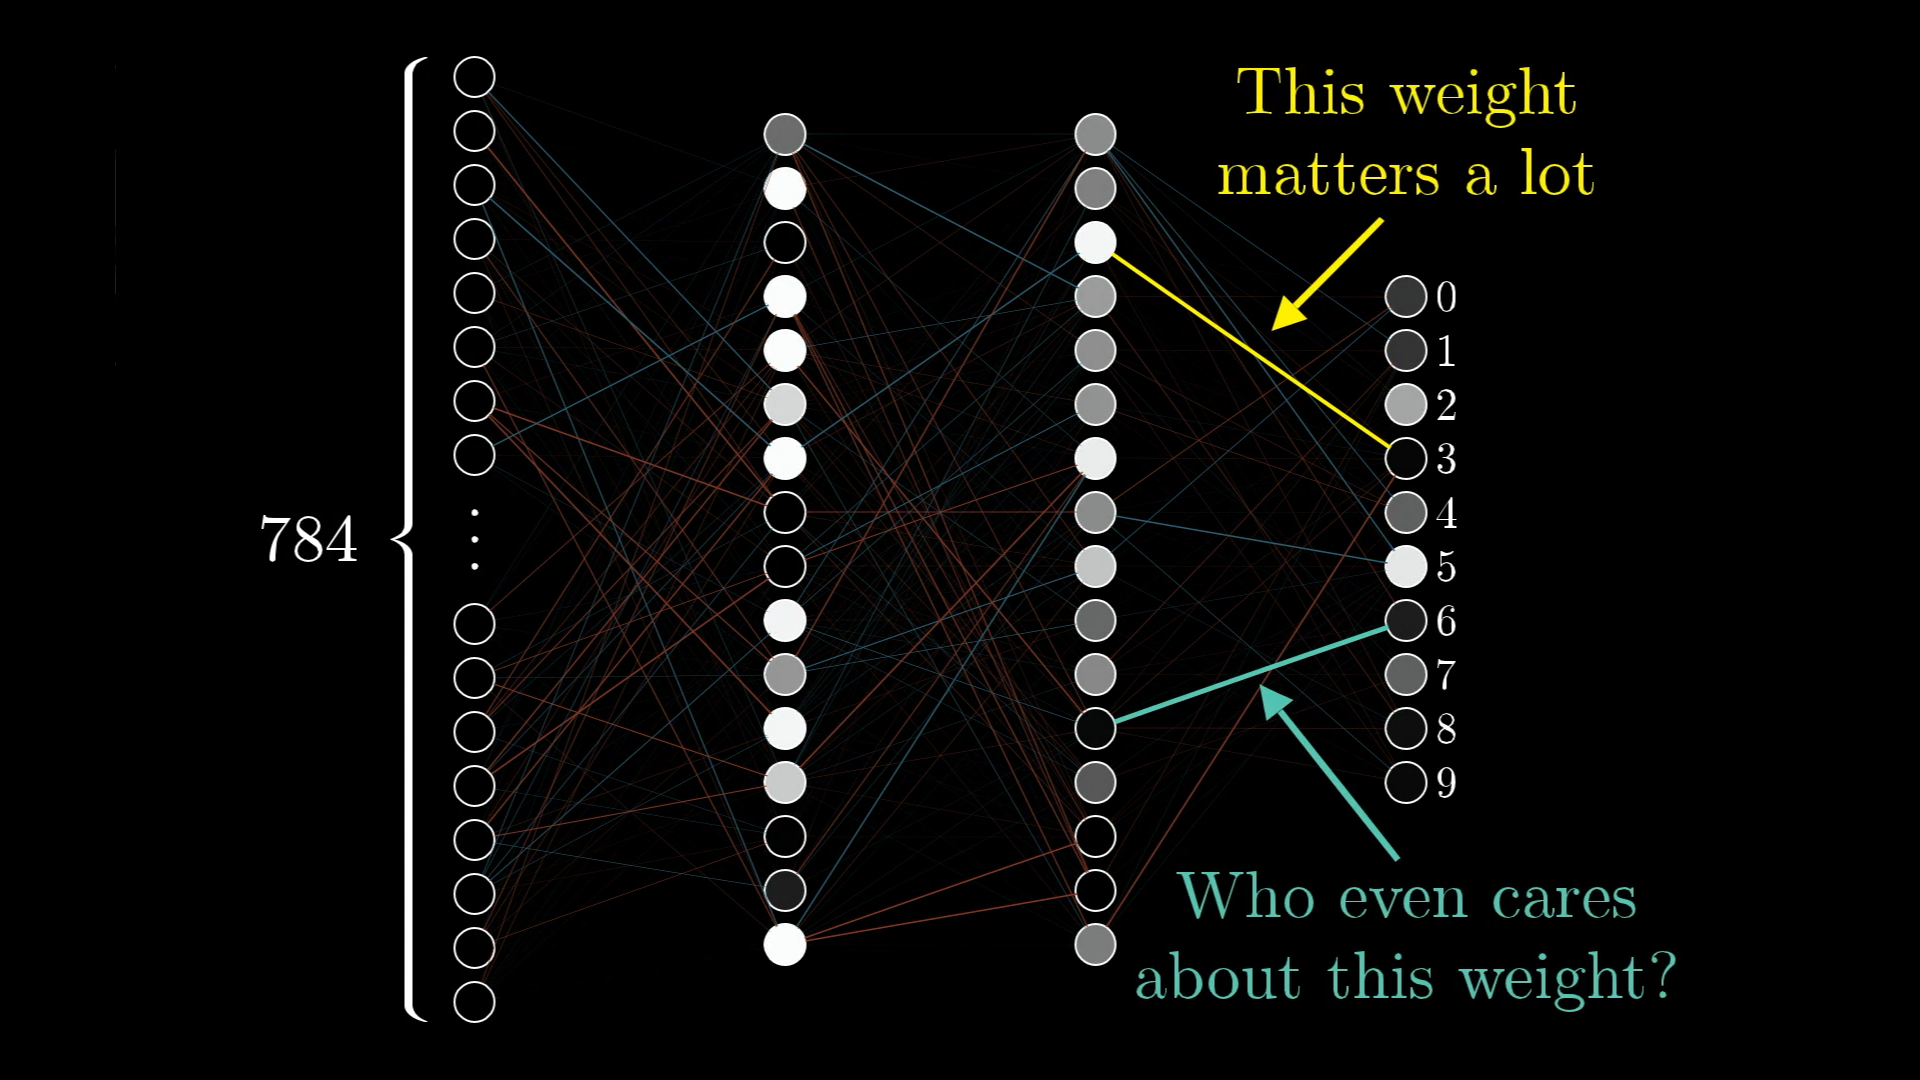
Some connections in our network have a much bigger impact on the final result than others. The gradient naturally encodes this importance!
High Gradient Component
Large change in cost function
→ This weight really matters!
→ Make a bigger adjustment
Low Gradient Component
Small change in cost function
→ This weight doesn't matter much
→ Make a smaller adjustment
🏋️ The Training Process in Action
Step by Step:
- Feed training data through the network
- Calculate the cost (how wrong were we?)
- Compute the gradient (which way is downhill?)
- Update all weights and biases (take a step downhill)
- Repeat with more training data
🔮 What's Coming Next: Backpropagation
We've learned what gradient descent does, but how do we actually compute that gradient for a neural network?
The ingenious algorithm that efficiently calculates gradients in neural networks.
But that's a story for our next lesson! 📚
🎓 Key Takeaways
🧠 Learning = Optimization
Neural network learning is really just finding the best values for thousands of parameters by minimizing a cost function.
🏔️ Gradient Descent
- Like rolling a ball downhill
- Follow the negative gradient
- Take small steps iteratively
- Eventually reach a minimum
📊 The Gradient Vector
- Shows direction of steepest ascent
- Magnitude indicates importance
- Guides parameter updates
- Computed via backpropagation
.jpg)
🚀 The Journey Continues...
Next up: Backpropagation - the algorithm that makes it all possible!