2^(2^10) = 2^1024 possible functions
For just 10 yes/no features!
That's more than the number of atoms
in the observable universe!
Understanding Hypothesis Space, Inductive Bias, Evaluation & Cross-Validation
Dr. Dhaval Patel • 2025
Think of machine learning like teaching a child to recognize different animals. Just as a child learns to distinguish between cats and dogs by seeing many examples, machine learning algorithms learn patterns from data to make predictions about new, unseen information.
The set of Possible Solutions
Imagine you're looking for a house in a city. The hypothesis space is like all the possible houses that exist in that city - every single building that could potentially be your new home.
Hypothesis Space: All possible straight lines (y = mx + b)
Each Hypothesis: One specific line with particular slope and intercept
Goal: Find the line that best fits our data points
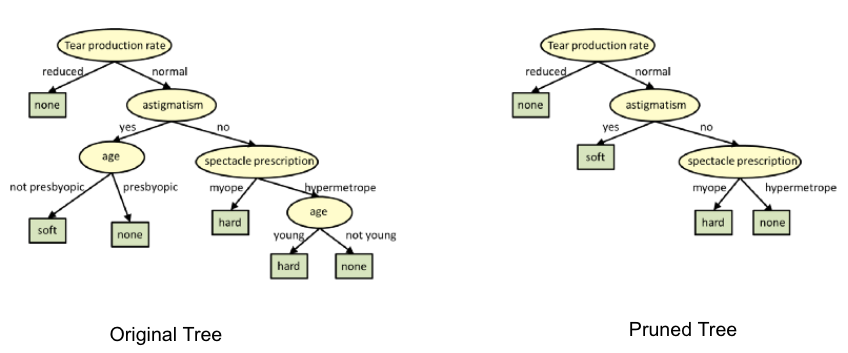
Hypothesis Space: All possible decision trees we can build
Each Hypothesis: One specific tree structure with particular splits
Goal: Find the tree that makes the most accurate predictions
For just 10 yes/no features!
That's more than the number of atoms
in the observable universe!
The Guiding Principles
Inductive bias is like having a wise mentor who gives you helpful assumptions and guidelines to narrow down your search.
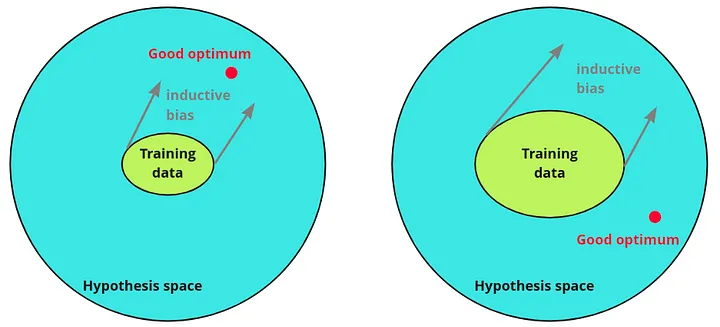
Think of it as:
Architectural Constraints
Like choosing to only look for houses in certain neighborhoods.
Selection Criteria
Like preferring simpler, more elegant solutions.
You could come up with a few rules:
Each machine learning algorithm has its own "personality" - its built-in assumptions about how the world works:
Too Restrictive (Underfitting): Like only reading children's picture books when you need advanced mathematics. Model too simple to capture important patterns.
Too Flexible (Overfitting): Like memorizing every page without understanding. Model learns noise instead of true patterns.
How Do We Know If We're Doing Well?
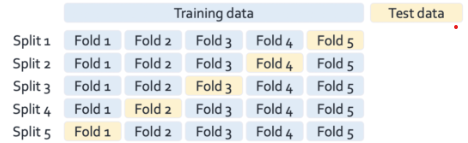
Imagine you're a teacher grading students. You wouldn't just look at homework performance; you'd give them tests on new problems to see if they truly understand the material.
Similarly, we need to test our ML models on new, unseen data to measure their real-world performance.
The foundation for understanding all classification metrics
These four equations form the foundation of classification evaluation, all derived from the confusion matrix components:
Overall correctness: What proportion of all predictions were correct?
Quality of positive predictions: Of all positive predictions, how many were actually correct?
Coverage of actual positives: Of all actual positive cases, how many did we identify?
Harmonic mean: Balanced measure combining both precision and recall into a single score.
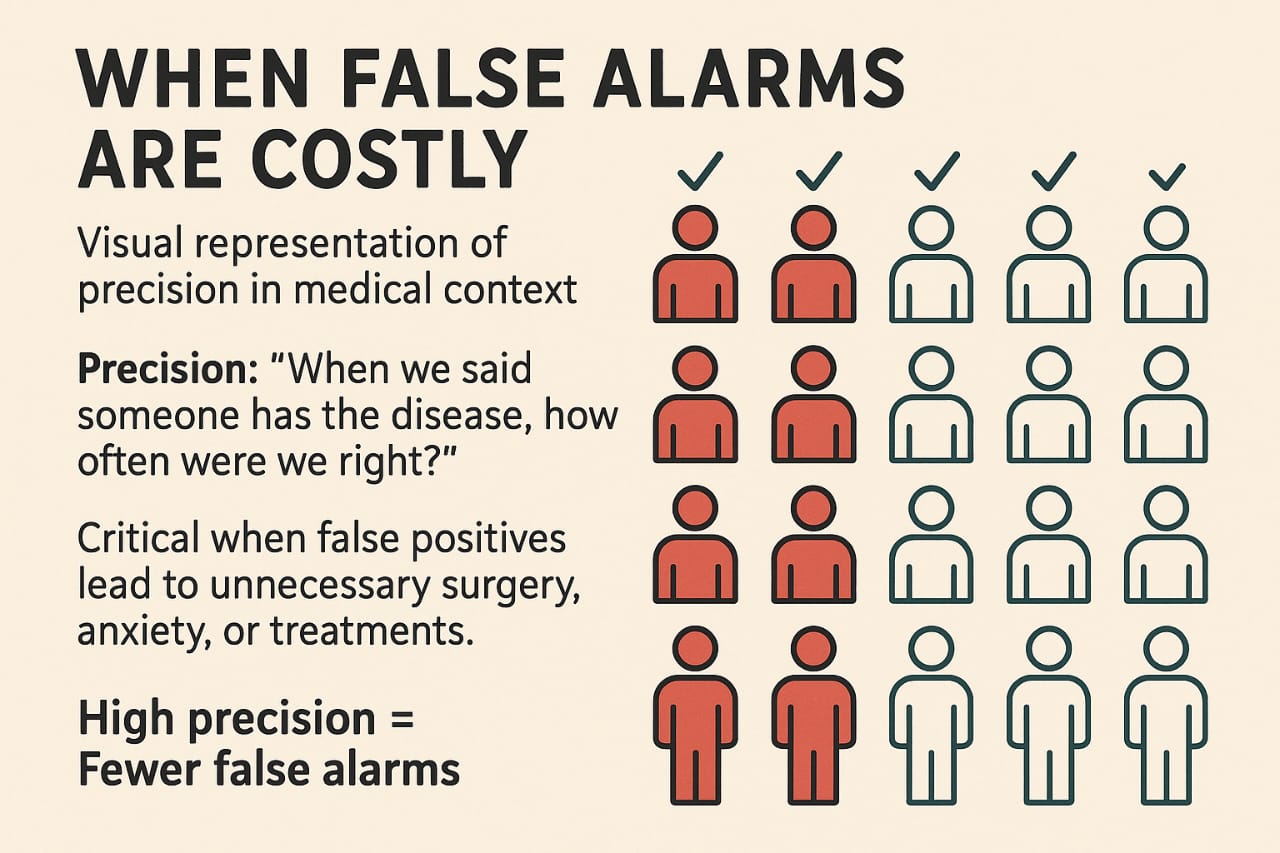
Precision: "When we said someone has the disease, how often were we right?"
Critical when false positives lead to unnecessary surgery, anxiety, or treatments.
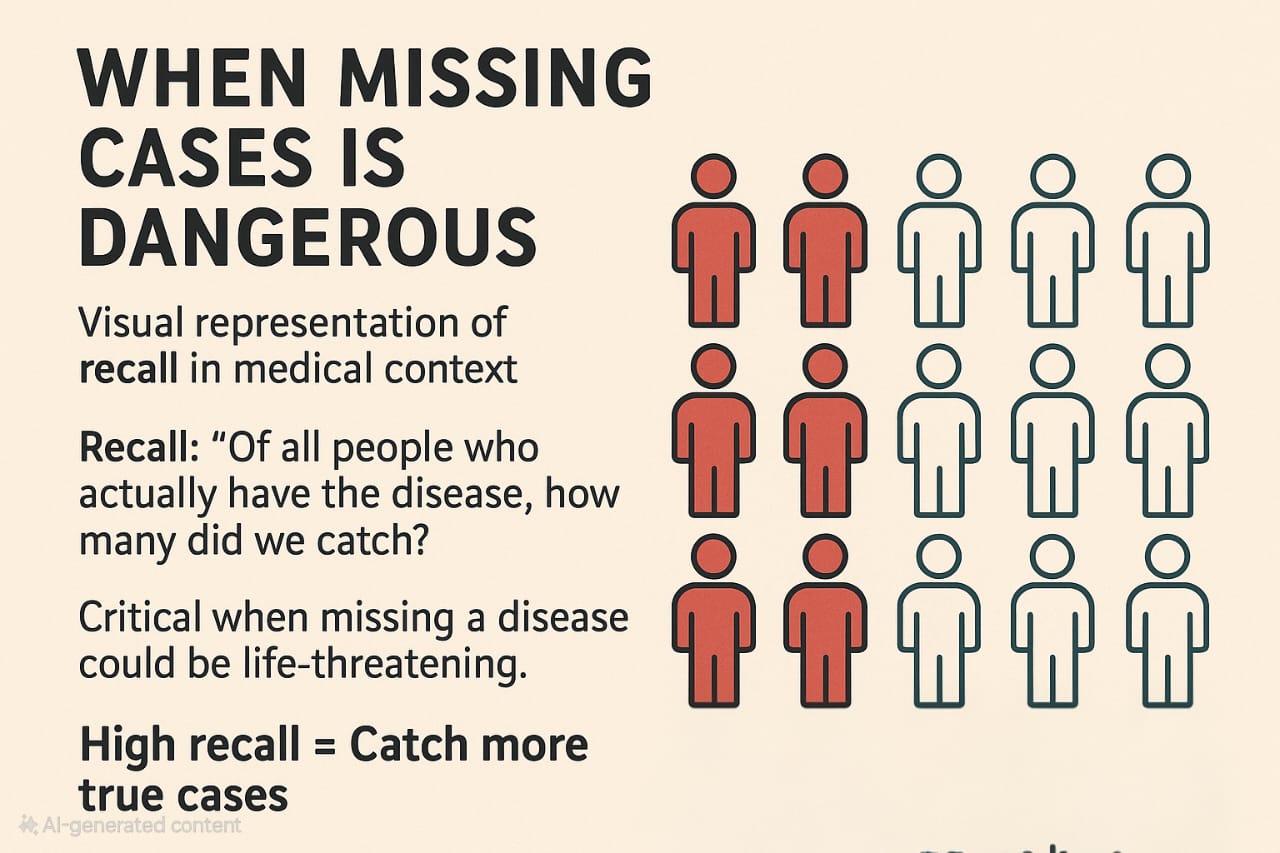
Recall: "Of all people who actually have the disease, how many did we catch?"
Critical when missing a disease could be life-threatening.
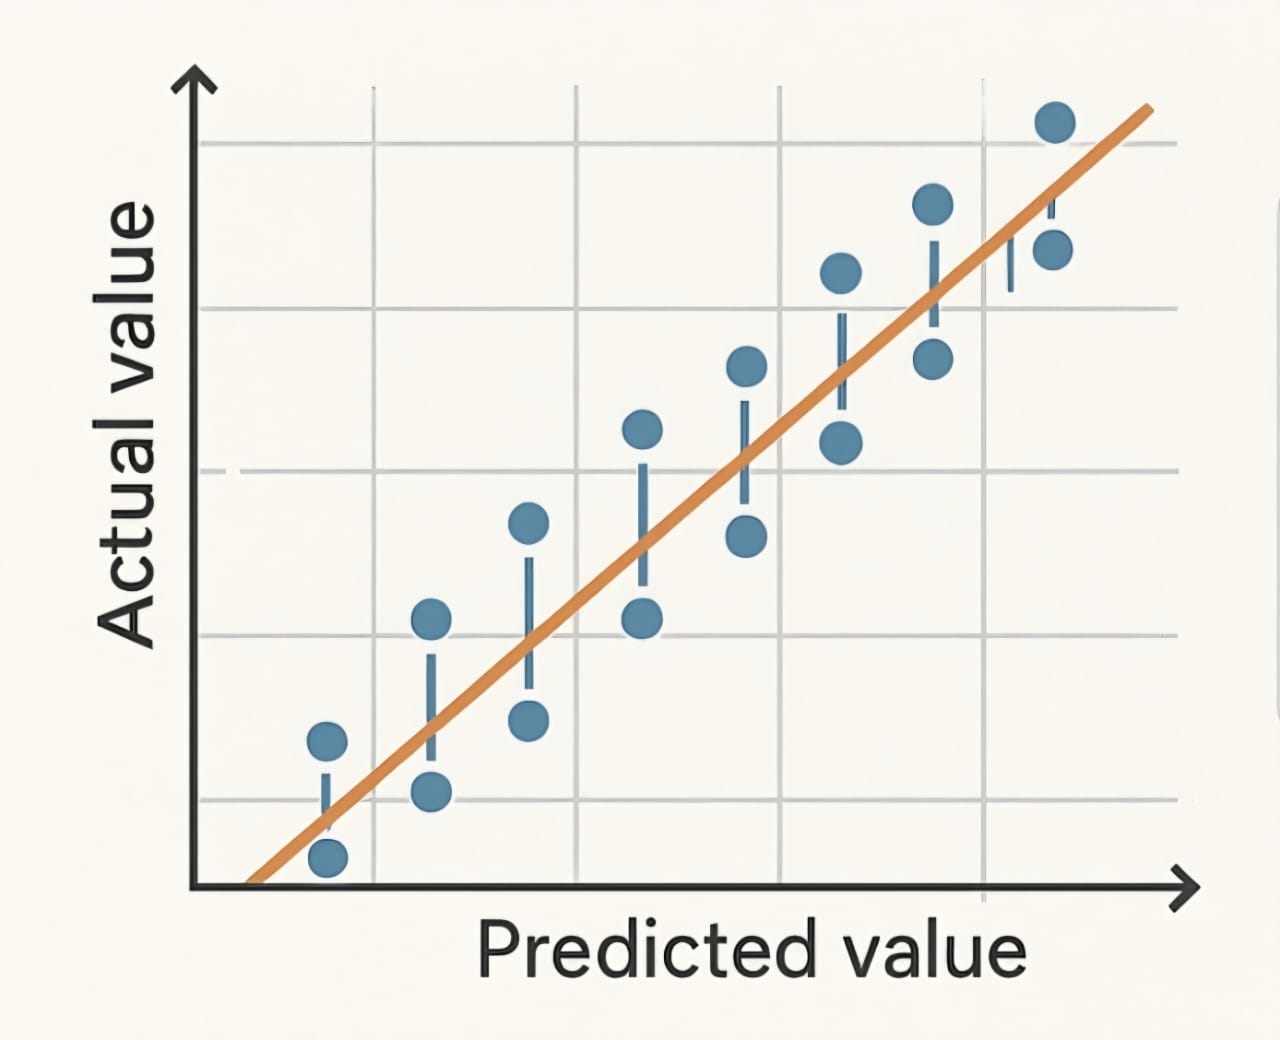
When predicting continuous values like house prices or temperatures, we need different metrics:
The Ultimate Reality Check
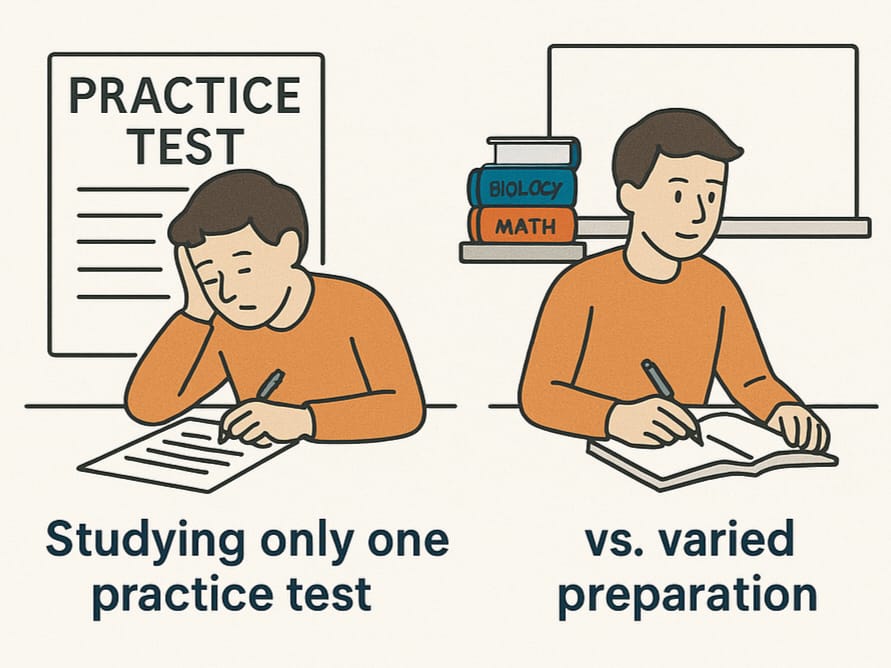
Studying only one practice test vs. comprehensive preparation
Process: Split data into k groups, test on each group once
Common choice: k = 5 or k = 10
Process: Test on each individual data point, train on all others
Downside: Computationally expensive for large datasets
Cross-validation helps us find the best settings (learning rate, tree depth, etc.) without overfitting to our test set.
Example: Testing different values of k in k-nearest neighbors to find the optimal number of neighbors to consider.
When choosing between algorithms (linear regression vs decision trees vs neural networks), cross-validation gives reliable comparisons.
Example: Comparing average cross-validation scores to choose between Random Forest (87% accuracy) vs SVM (84% accuracy).
Remember these essential principles as you develop your machine learning expertise: